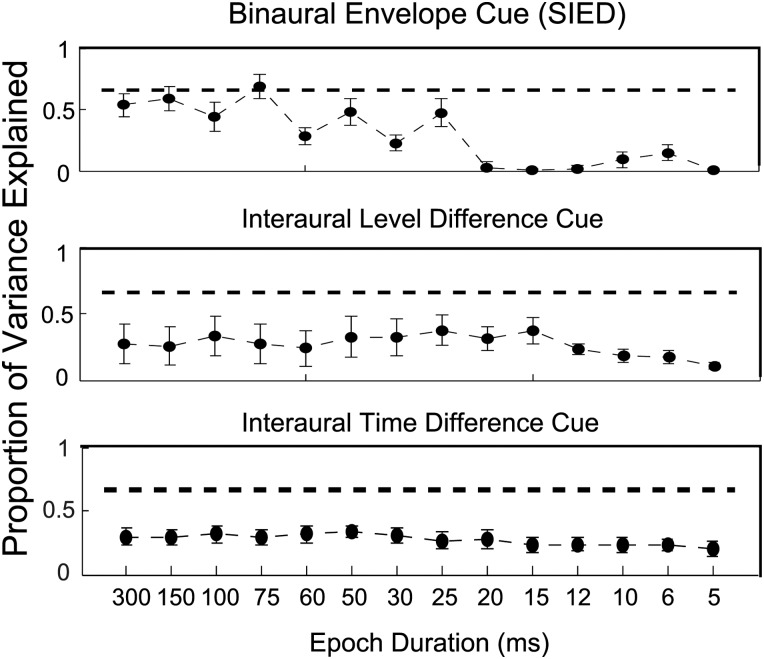
Figure 4.
Proportion of variance explained by the SIED (upper panel), ILD (middle panel), and ITD (bottom panel) cues for the average listener, based on all responses to the Evilsizer et al. (2002) stimuli, for wideband waveforms using different epoch durations. The dotted line shows the predictable variance for the wideband conditions. The x axis shows the epoch durations, and different filled circles represent predictions for wideband waveforms. The average listener was computed across six listeners for the wideband condition.

