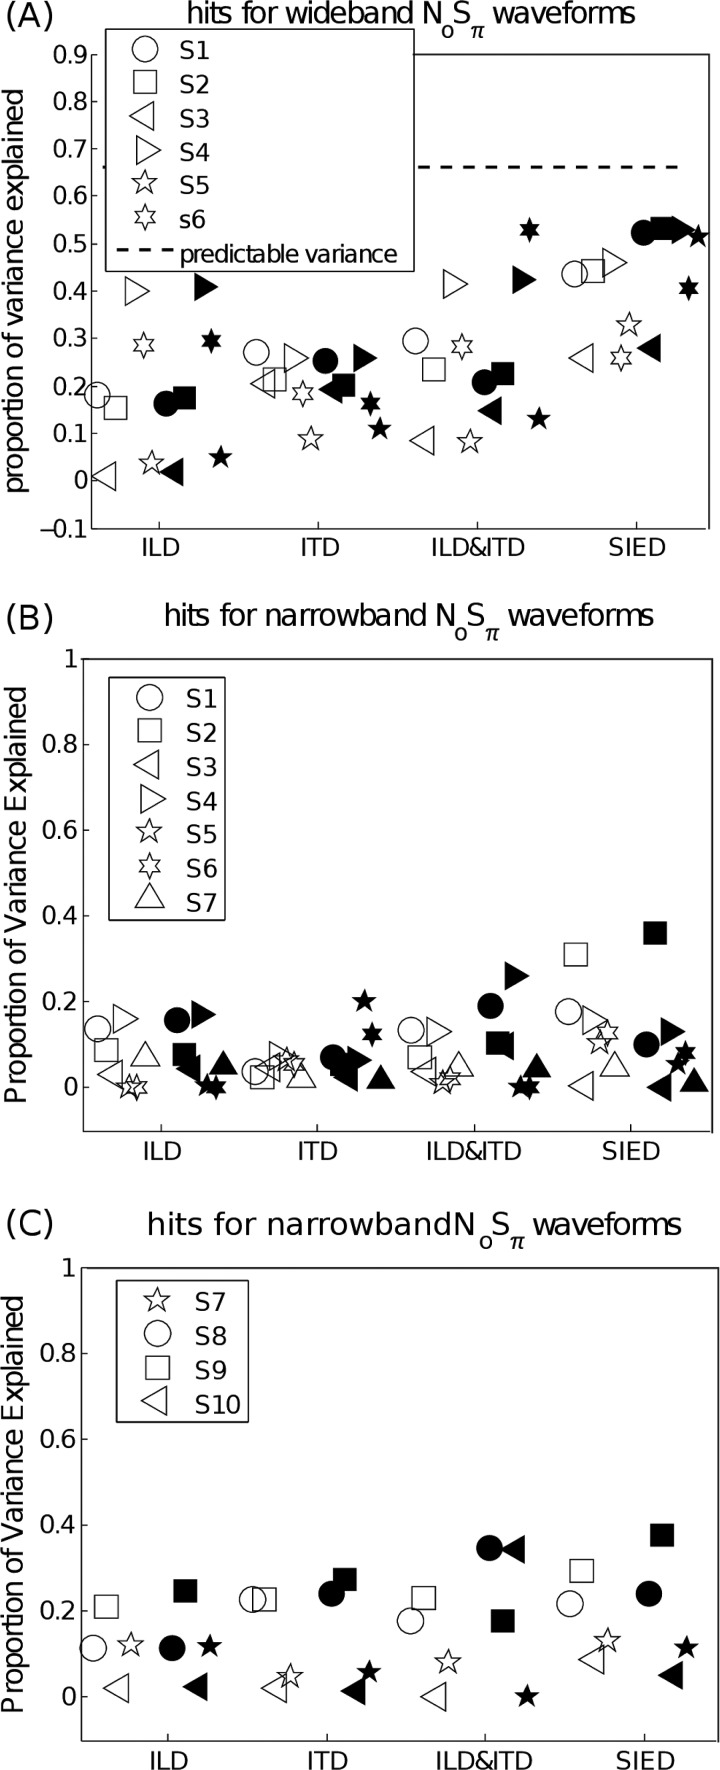
Figure 5.
The proportion of variance explained by several interaural difference cues (ILD, ITD, a combination of ILD and ITD, and SIED) predictions of hit rates for the individual listeners for waveforms of Evilsizer et al. (2002) study [(A) and (B)] and waveforms of Isabelle (1995) study [(C)]. The epoch duration was 75 ms for the multiple-epoch models (filled symbols). Different listeners were represented by different symbols.

