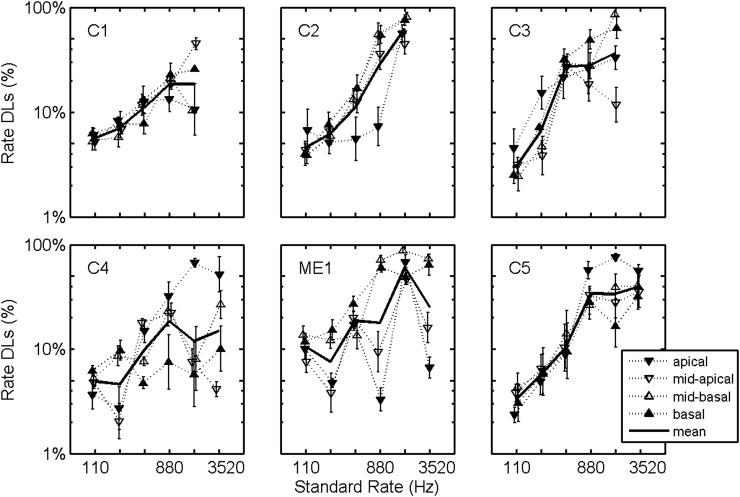
Figure 4.
Rate DLs as a function of standard stimulation rate with electrode trends plotted. Individual symbols plot logarithmic averages across rates and test sessions 1–7. Solid lines plot corresponding logarithmic averages across electrodes, rates, and test sessions 1–7. Error bars plot standard errors of the means.

