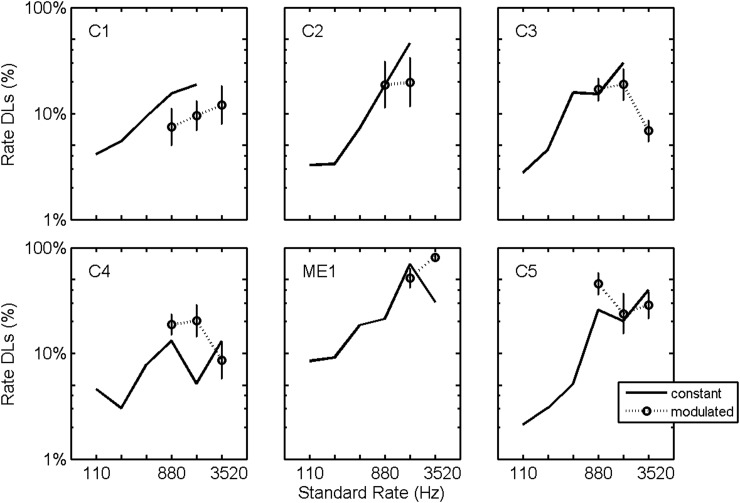
Figure 6.
Effect of sinusoidal amplitude modulation. Rate DLs plotted as a function of standard stimulation rate for constant level (replotted from Fig. 3) and for sinusoidally amplitude modulated (dotted lines) stimuli. Plotted DLs are logarithmic averages across electrodes. Error bars plot standard errors of the means.

