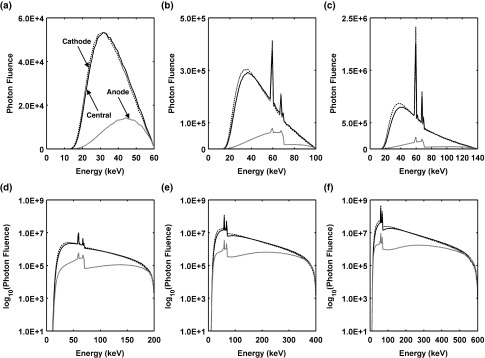
Figure 13.

Spectral comparison of the cathode, central ray, and anode directions of x-ray tube field of view [see Fig. 1b] for (a) 60 kV, (b) 100 kV, (c) 140 kV, (d) 200 kV, (e) 400 kV, and (f) 600 kV simulated x-ray spectra. All spectra in this figure contain 2.5 mm of aluminum filtration to reflect results from conventional x-ray tubs with permanent filtration.
