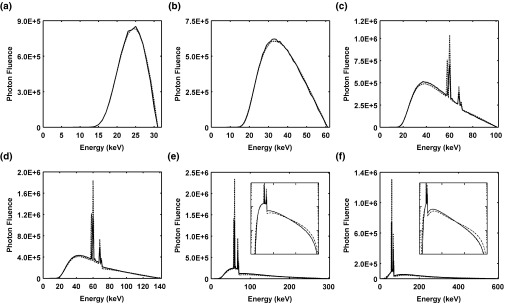
Figure 7.

Comparison of x-ray spectra generated using TASMICS (solid lines) and Birch and Marshall's model (dashed lines). (a) 30 kV spectrum, R2 = 0.998, slope = 0.999; (b) 60 kV spectrum, R2 = 0.999, slope = 0.995; (c) 100 kV spectrum, R2 = 0.907, slope = 1.034; (d) 140 kV spectrum, R2 = 0.777, slope = 1.104; (e) 300 kV spectrum and inset figure in log scale to better visual spectral comparisons, R2 = 0.697, slope = 1.259; and (f) 600 kV and inset figure in log scale, R2 = 0.690, slope = 1.267.
