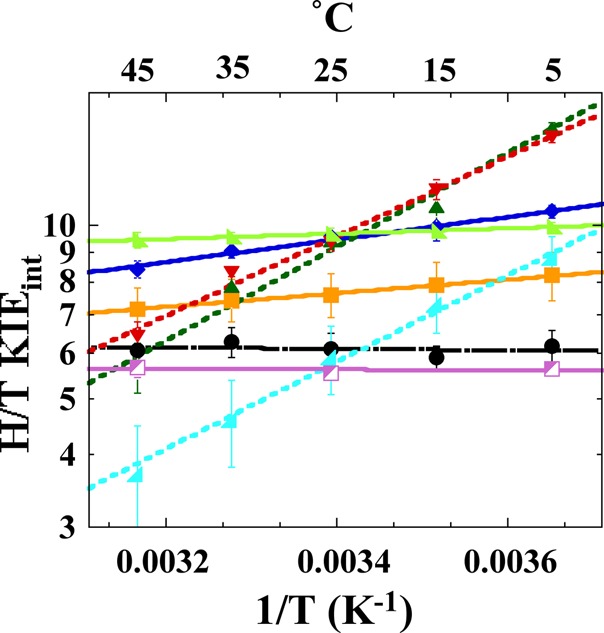
Figure 2.

Comparison of Arrhenius plots of intrinsic H/T KIEs of WT (black; ref (30)) and distal DHFR mutants: W133F (magenta), M42W (orange; ref (28)), G121V (light green; ref (29)), F125M (dark blue), M42W-F125M (dark green), G121V-F125M (red), M42W-G121V (light blue; ref (25)). The lines represent the nonlinear regression to Arrhenius equation; dashed lines are used for WT, solid lines for single mutants and dotted lines for the double mutants. The error bars represent standard deviation.
