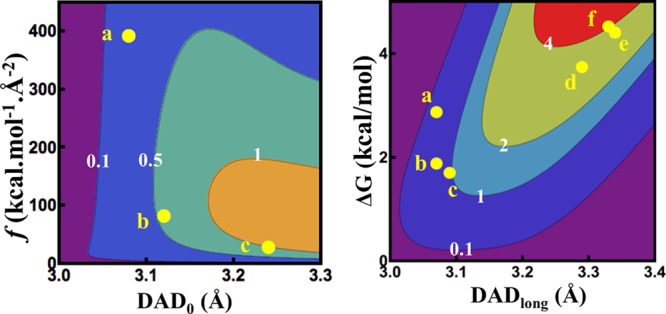
Figure 4.

Contour plots of ΔEa in kcal/mol (values in white digits) as a function of (left) average DAD (DAD0) and force constant (f) and (right) DAD of the long population (DADlong) and the difference in free energy between the two populations (ΔG). The yellow dots represent the different mutants and are labeled as follows: a, G121V; b, M42W; c, F125M; d, G121V-F125M; e, M42W-G121V; f, M42W-F125M (errors for all the points are smaller than the dot representing the data).
