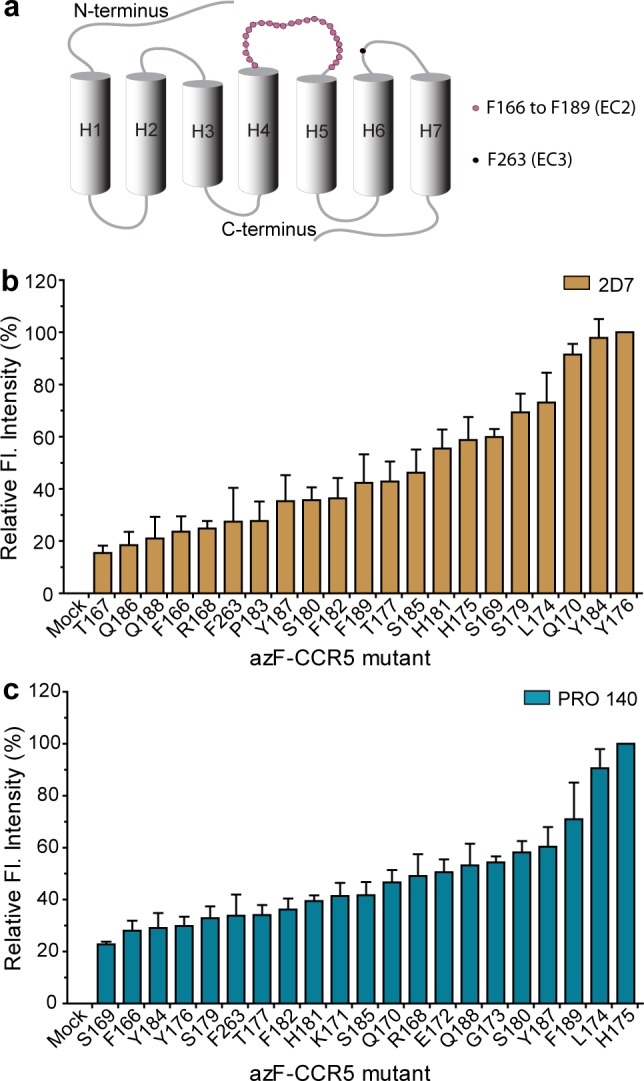
Figure 3.

ELISA analysis of binding and photo-cross-linking of azF-CCR5 mutants, expressed in HEK293T cells. (a) CCR5 schematic showing sites of azF incorporaton. (b) Photo-cross-linking to 2D7, relative levels obtained by normalizing to Y176azF-CCR5. (c) Photo-cross-linking to PRO 140, relative levels obtained by normalizing to H175azF-CCR5. Error bars represent the standard error of the mean from three or four independent trials, each performed in duplicate or triplicate.
