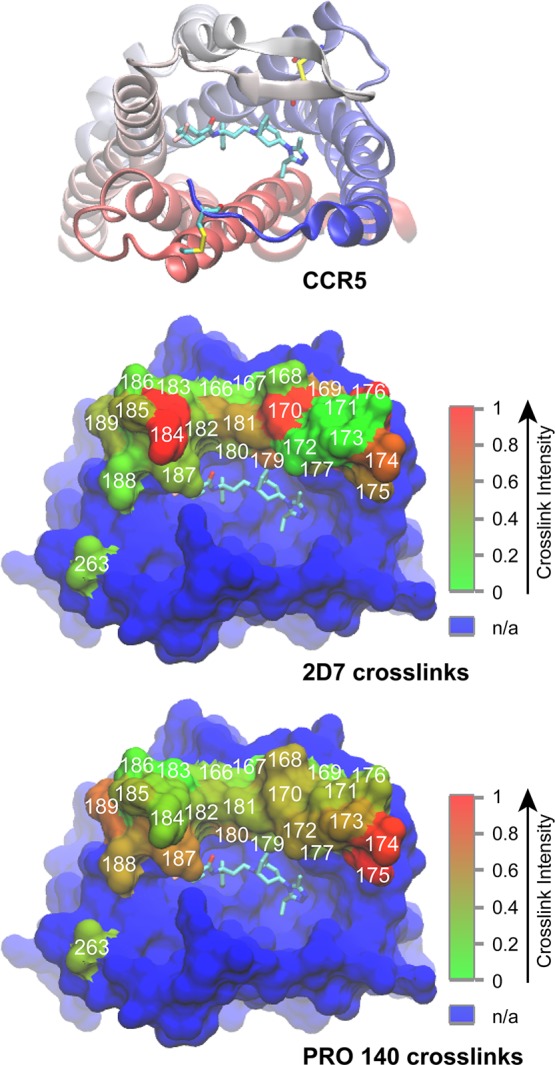
Figure 5.

Interpretation of cross-linking data according to the crystal structure of the CCR5–maraviroc complex (Protein Data Bank entry 4MBS).29 Ribbon diagram of CCR5 as viewed from the extracellular surface of the receptor with the N-terminus colored blue, fading to red at the C-terminus. Maraviroc and disulfide-linked Cys residues are shown as sticks (cyan carbons). Surface representation of CCR5 with residues cross-linked to 2D7 (middle) and PRO 140 (bottom) colored red fading to green. Residues substituted with azF are numbered in white. The color bar indicates the range of relative cross-linking signals from non-cross-linked sites (green) to cross-linked sites (red). The blue surface corresponds to residues not tested in this study. Molecular graphics were prepared with VMD version 1.9.1.66
