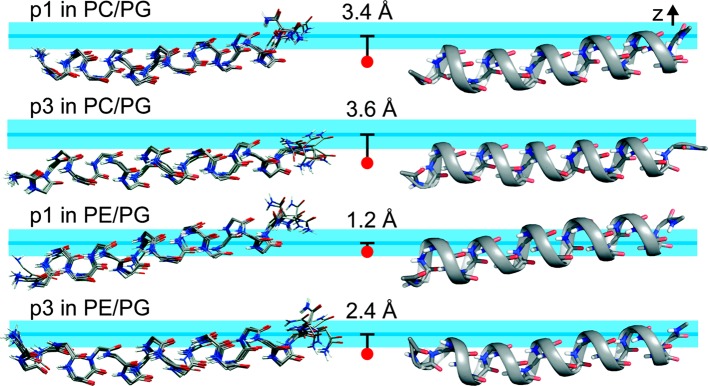
Figure 6.

Ten lowest-energy backbone structures (left) and ribbon structures for the lowest-energy conformations (right) of p1 and p3 in 3:1 DMPC/DMPG and 1:1 POPE/POPG. These Xplor-NIH refined structures were calculated using ssNMR 15N chemical shifts and 15N/1H dipolar couplings. Peptides are aligned with the N-termini on the left. Considering residues 3–20 that show α-helicity, the rmsd values between the top 10 structures of each ensemble and their mean structures are 0.39 and 0.37 Å for p1 in PC/PG and PE/PG, respectively, and 0.39 and 0.35 Å for p3 in PC/PG and PE/PG, respectively (Table S5). Cross-correlation plots between experimental and calculated 1H–15N DNH and 15N CSA are shown in Figure 5. Three properties obtained from the MD simulations are included to show the average position of the C2 plane of the bulk lipids (horizontal blue line) relative to the fixed peptide: the z-position of the CM for backbone atoms of residues 3–10 and residues 14–20 (red dot); the average depth of insertion of the peptide (the distance between the blue line and red dot); and the fluctuations of the C2 plane with respect to the CM of the peptide (light blue horizontal band with thickness ±2rmsf = ±1.8 Å). Hence, the C2 plane fluctuates within the blue band with respect to the peptide.
