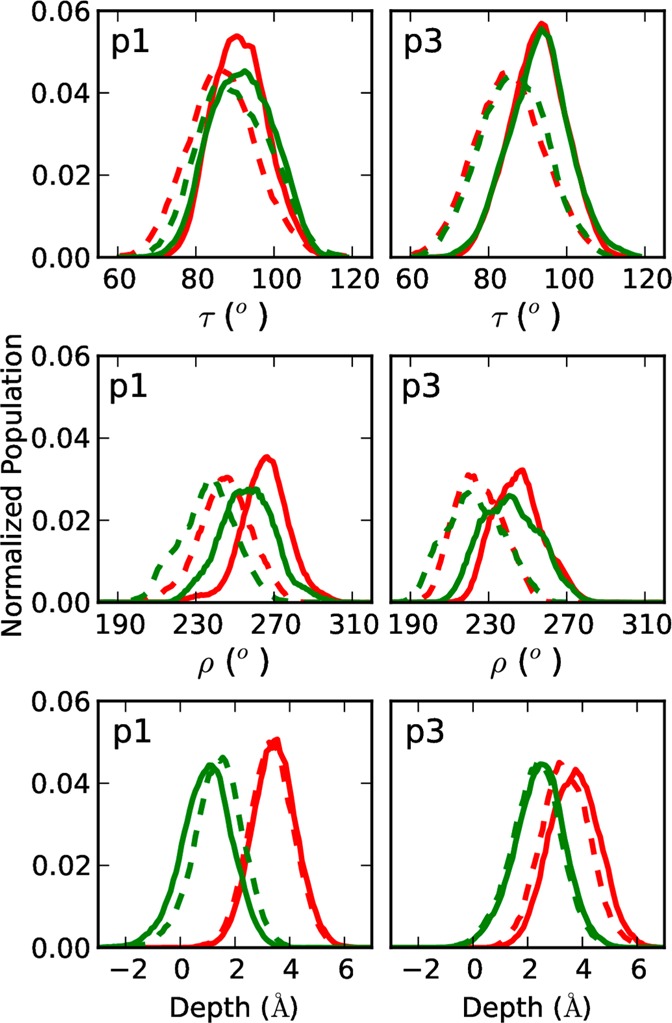
Figure 7.

Distribution of tilt angles (top), azimuthal rotation angles (middle), and depths of insertion (bottom) sampled by p1 (left) or p3 (right) in PC/PG (red) or PE/PG (green) during the entire MD simulation (90 ns). Curves for N- and C-terminal residues are shown as solid and dashed lines, respectively.
