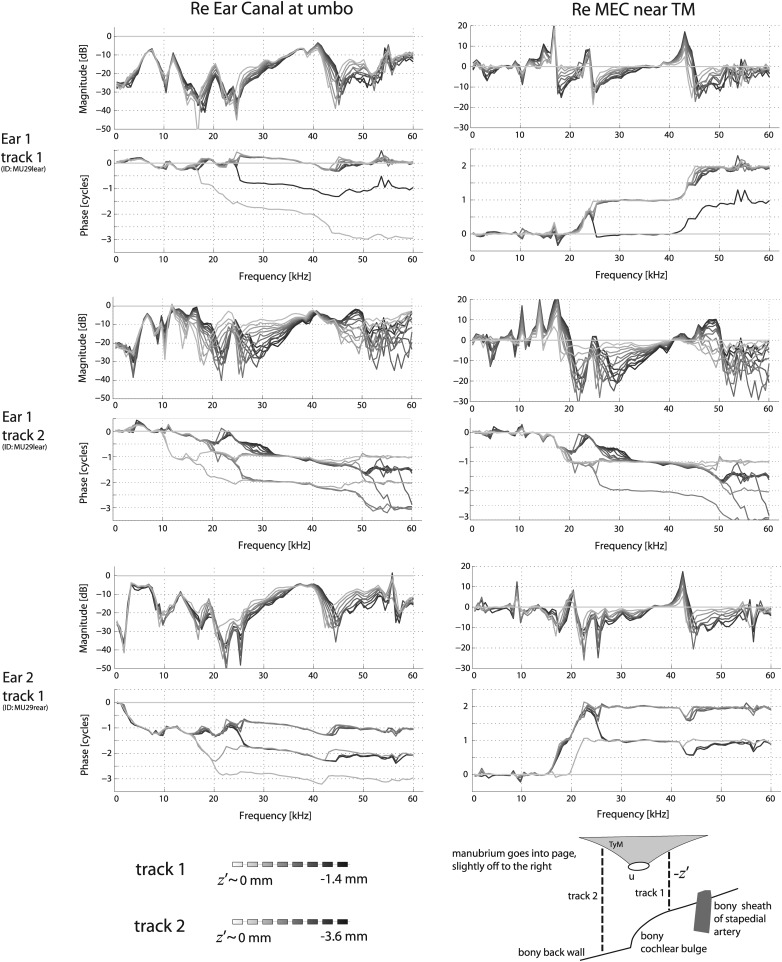
Figure 6.
Variations in pressure in the MEC as the sensor was moved from close to the TM toward the back bony wall [PMEC(−z′)] for different placements along (x, y) as indicated in the bottom panel. The left column shows the response for a given z′ track relative to the EC-side pressure at the umbo {i.e., } while the right-hand column is relative to the MEC-side pressure closest to the TM {i.e., }. Darker curves indicate locations further away from the TM (closer to the back bony wall). Note that for these runs, the starting point was close to the TM but not right at the umbo (lower right schematic). Two different z′ tracks for one ear are shown here (thick lines in bottom schematic), while only one is shown for a second ear.

