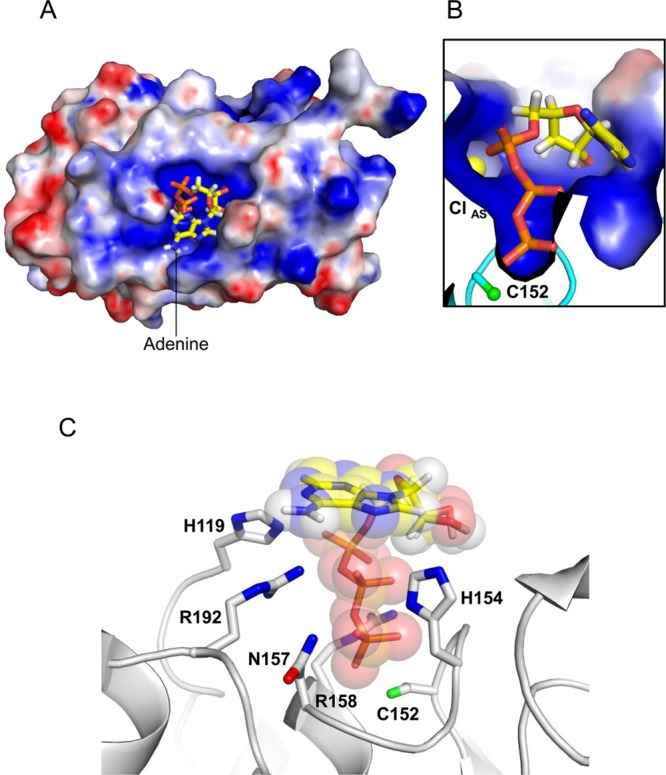
Figure 5.

Modeling ATP inside the PIR1-core active site. (A) Model of ATP docked onto the electrostatic potential molecular surface of PIR1-C152S-core computed at neutral pH. (B) Magnified view of the ATP triphosphate tail docked inside the PIR1 active site crevice. (C) Ribbon diagram of PIR1 (gray) bound to ATP (shown as sticks overlaid with transparent spheres corresponding to van der Waals radii). PIR1 residues involved in ATP binding and subjected to site-directed mutagenesis are indicated (for the sake of clarity, hydrogen atoms are shown for only ATP). In all panels, ATP is colored by element, with carbon, hydrogen, nitrogen, oxygen, and phosphate atoms colored yellow, white, blue, red, and orange, respectively.
