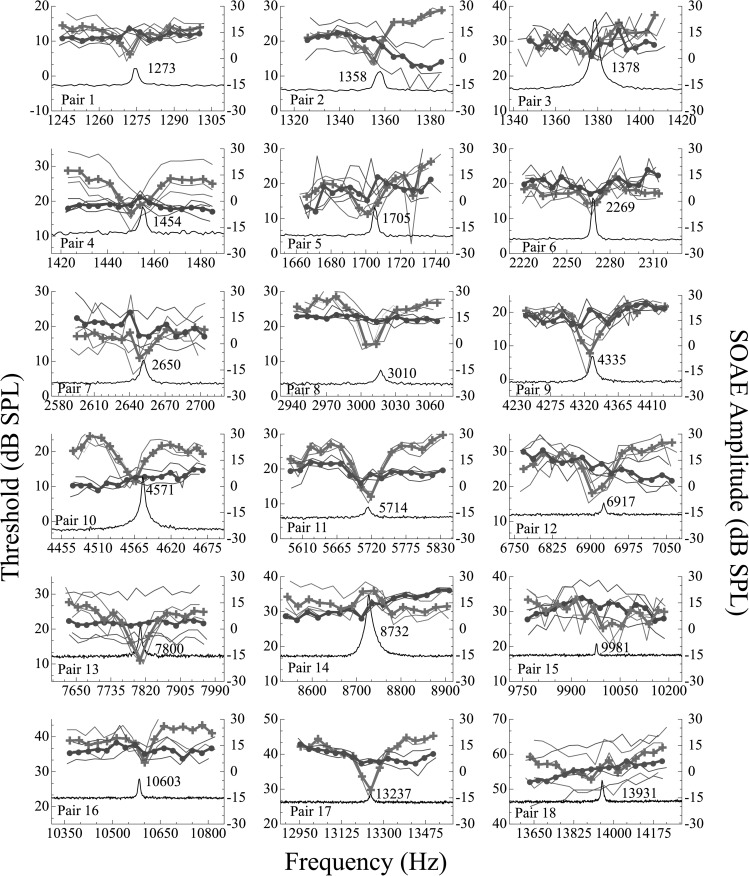
Figure 2.
(Color online) Behavioral thresholds in dB SPL as a function of frequency for all subject pairs (n = 18 pairs). Microstructure data for SOAE+ subjects are indicated by the crosses and for SOAE− subjects, the circles. The right ordinate represents SOAE amplitude in dB SPL. The black traces are SOAE spectra in SOAE+ subjects with the frequency indicated next to the peak. Thresholds from each of three sessions are presented as thin lines. Mean data (thick lines) are based on the average of all three trials. The SOAEs under study encompass a wide array of levels and frequencies. Subjects with SOAEs demonstrate microstructure regardless of emission frequency or amplitude with the exception of three cases. Note that SOAE+ subject 14 demonstrates an inverted microstructure pattern, while SOAE+ subjects 15 and 18 do not exhibit microstructure that satisfies the 5 dB criterion.

