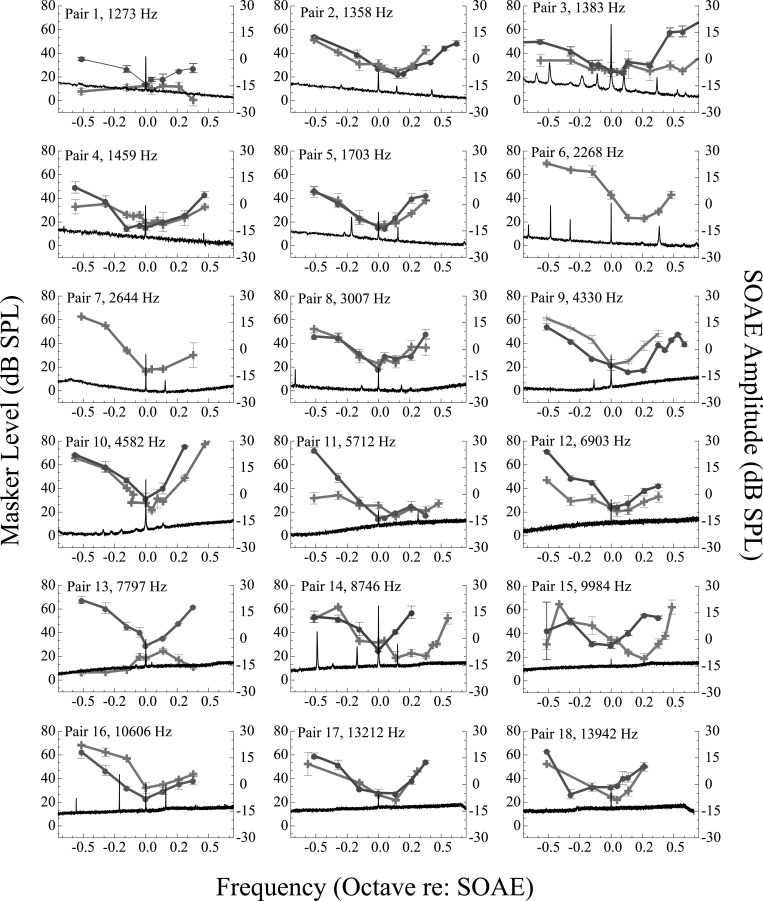
Figure 4.
(Color online) PTCs as a function of frequency for all subject pairs. The PTCs of SOAE+ and SOAE− subjects are indicated by the crosses and circles, respectively. SOAE+ subjects 6 and 7 have no match, thus data are presented unpaired. Error bars are ±1 SD of the mean. Spectra of the SOAEs under study are visible in the lower portion of each panel (black trace) and align with 0 octaves re: SOAE. Subjects with multiple SOAEs are more likely to demonstrate PTCs with shifted tips, as well as PTCs with multiple minima. Subjects with high-frequency SOAEs tend to have PTCs with shifted tips compared to subjects with low-frequency SOAEs. Emission amplitude appears unrelated to these anomalies.

