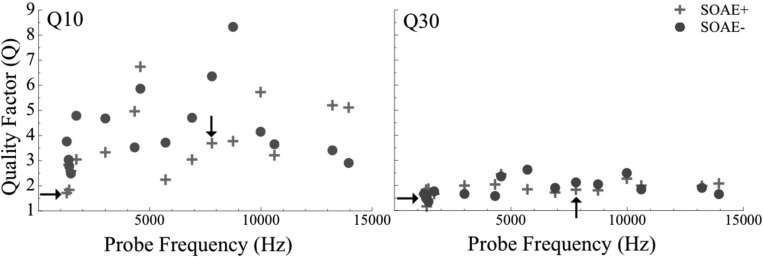
Figure 6.
(Color online) Sharpness of PTCs measured by Q10 (left) and Q30 (right) as a function of probe frequency (Hz). SOAE+ data are presented as crosses and SOAE− data as circles (n = 16 per group). Tuning data for subjects 6 and 7 were removed because control subjects were unavailable for PTC assessment. No frequency-dependent relation between tuning and frequency is observed. Arrows indicate tuning values for subjects with inverted PTCs. The difference in Q10 and Q30 is not statistically significant between SOAE+ and SOAE− subjects according to a Wilcoxon Signed Rank Test (p > 0.05, n = 14 pairs). Similarly, no difference in tuning values was observed between SOAE+ subjects with low-frequency emissions compared to those in the high-frequency group (>4.3 kHz) according to a Mann-Whitney U Test. Tuning data from inverted PTCs were not included in these analyses.

