Abstract
To facilitate non-invasive diagnosis of anemia, specific equipment was developed, and non-invasive hemoglobin (HB) detection method based on back propagation artificial neural network (BP-ANN) was studied. In this paper, we combined a broadband light source composed of 9 LEDs with grating spectrograph and Si photodiode array, and then developed a high-performance spectrophotometric system. By using this equipment, fingertip spectra of 109 volunteers were measured. In order to deduct the interference of redundant data, principal component analysis (PCA) was applied to reduce the dimensionality of collected spectra. Then the principal components of the spectra were taken as input of BP-ANN model. On this basis we obtained the optimal network structure, in which node numbers of input layer, hidden layer, and output layer was 9, 11, and 1. Calibration and correction sample sets were used for analyzing the accuracy of non-invasive hemoglobin measurement, and prediction sample set was used for testing the adaptability of the model. The correlation coefficient of network model established by this method is 0.94, standard error of calibration, correction, and prediction are 11.29g/L, 11.47g/L, and 11.01g/L respectively. The result proves that there exist good correlations between spectra of three sample sets and actual hemoglobin level, and the model has a good robustness. It is indicated that the developed spectrophotometric system has potential for the non-invasive detection of HB levels with the method of BP-ANN combined with PCA.
OCIS codes: (070.4790) Spectrum analysis, (170.1470) Blood or tissue constituent monitoring
1. Introduction
Anemia is common frequently-occurring disease. The statistics from the World Health Organization show that about 1.62 billion people suffered from anemia of different degree in the world [1], more than 10 million people died of all kinds of diseases caused by anemia every year. In patients with anemia, the female is more than the male; neonates are significantly more than the young and middle-aged. At present, the reported anemia incidence of neonates varies between 30% and 40%. Maternal anemia during pregnancy is a very significant reason. It will severely affect the development of sick babies’ physique and intelligence. Sick babies usually show symptoms of anorexia, picky about food, decline in resistance to a variety of infections, et al. Therefore, early diagnosis of neonatal anemia will be of great importance in prevention and control of this kind of disease.
Clinically, anemia disease can be diagnosed by measuring hemoglobin (HB) levels. The shortcomings of conventional method of clinical biochemical measurement are: needing to draw blood which increase pain of patients and cause the spread of infectious diseases of the blood and body fluids easily; feedback is slow and it is difficult to achieve continuous real-time monitoring. Blood vessels of neonates are narrow, blood volume is low. So it is very inconvenience for drawing blood of neonates, and also increases the risk of infection. To some degree, the situation affects the anemia diseases early prevention and treatment in time. For this reason, non-invasive HB detection of neonates has great value in prevention and control of these diseases. In addition, for some special occasions, such as the operating room, the battlefield, the wild, the space station and so on, non-invasive measurement technology of human HB will also has broad prospects in application.
Near infrared spectroscopy(NIR) is a nondestructive, fast, without chemical reagents, multi-component detection method, which make this technology widespread used in agriculture, food, pharmacy, chemical industry and other fields [2–8]. NIR also has a good penetrability for body fluid and soft tissue, so it is firmly believed as one of the most potential method for non-invasive biochemical detection [9].
In 1992, Norris published a book entitled “possible medical applications of NIR” [10]. Then he put forward “Near infrared hemoglobinometry”, measured the spectra of in vitro blood samples, and got good analytical precision in 1995 [11]. These works got extensive attention of near infrared researchers. Hereafter, many scholars started researching on the project of non-invasive prediction of human HB levels by NIR [12–15]. Some of those methods used the experience of pulse oximetry. After years of development, Astrim [16] and Radical-7 [17, 18], with which we can obtain continuous non-invasive monitoring data of human HB, had been respectively produced by Sysmex Corporation and Masimo Corporation, and gradually applied in clinical. The relative detection error of the instruments was about 10%. However, the problems of not-highly detection accuracy and single detection indicator are still the obstacle for the technology to apply in clinic extensively [19].
The researchers are still searching for the design approach to further increase detection accuracy and develop non-invasive prediction of multiple indicators, thereby truly push this technology to reality.
Based on the target, in the article we tried to use a way different from former non-invasive HB prediction in system design and approach, while produced an image flattening NIR spectrophotometric system adopting broadband light source and grating .To get better signal noise ratio (SNR) and sampling rate, we took advantage of multiple array detectors and provide independent amplifier circuit for each detector. Using the NIR spectrophotometric system, we developed clinical test and collected in vivo spectra of volunteers. Combined PCA with BP-ANN, we choose the optimum network structure, built the NIR quantitative analysis model of volunteers’ HB level and discussed the non-invasive detection accuracy of human HB based on this method.
2 Instrument design
2.1 Light resource
Figure 1 shows a block diagram of this system. We use composite light source composed of LED rather than halogen tungsten lamp in the system which need broadband light source. Because the light source which makes lower heat effect can largely reduce the influence on the instrument detection accuracy for temperature change of the measured parts. 9 LEDs are selected to compose broadband light sources, which form the spectrum range from 600nm~1050nm.
Fig. 1.
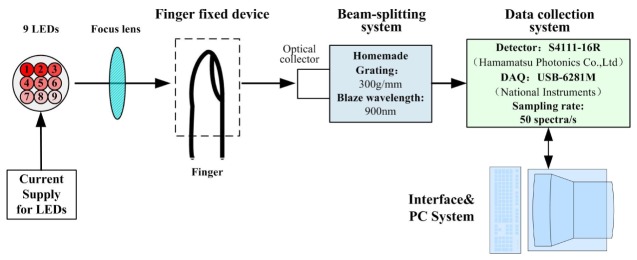
Block diagram of the near-infrared spectrophotometric system.
2.2 Finger fixed device
NIR light focus on an 8mm light spot by the optical system. We use special finger fixed tool which can better wrap the fingers. Making use of moderate pressure between the flexible material and the surface of finger, it can keep finger fixed on the light spot and effectively eliminate the slight uncontrollably shake and artificially displacement, thus improving the stability of human spectra.
2.3 Detector selection
The human body is a complex time-varying system. Blood flow in vessels changes periodically over time, which results in different time correspond to different blood flow volume. That is to say, we must strive to obtain full spectrum at the same time, avoiding the error introduced by scanning. So in this spectrophotometric system, we selected Si photodiode array with 16 elements (S4111-16R) from Hamamatsu Photonics Co., Ltd.
2.4 Beam-splitting system
The beam-splitting system mainly consists of a slit, collimating mirror, a plane grating, focus mirror and a Si photodiode array with 16 elements. The system structure is asymmetric Czerny-Turner which cannot only control the coma aberration but also stray light, suitable for using in weak signal detection. The blaze wavelength of grating is 900nm, groove density is 300g/mm, spectral range on image plane is 650~980nm.
2.5 Amplification system
In order to get low noise signal to the greatest extent, we provide mutually independent amplifying circuit for each element of the detector instead of the structure of single amplifier and multiplexing. So as to restrain noise interference, and realize weak signal amplifier, we design modified second order amplifying circuit and low-pass filter circuit, also conduct optimal design in aspects of printed circuit board arrangement and material choice. Circuit is put into metal box for shielding the influences on high-frequency interference to amplifying circuit signal. This realized high SNR amplifying signal output within 50Hz bandwidth.
2.6 Data collection system
Multi-function data acquisition card 6281M produced by National Instruments (NI) is selected for the data acquisition module. 6281M adopt 18 bits analog-digital conversion chip. The maximum sampling rate is 625kS/s, and the common mode rejection ratio is 110dB. Finally, the 100% line RMS noise of the NIR spectrophotometric system we developed is below 5 × 10⁻⁵Abs, and the average repetitive SNR of the 16 elements is higher than 20000:1. The sampling rate is 50 spectra per second.
3. Experimental section
In vivo spectral data were measured from physical examination volunteers at hospital in several days, by using the NIR spectrophotometric system (Fig. 2 ). The subjects were asked to abstain from food and alcohol from 9 p.m. on the previous day until the end of the experiment on the next morning. Each volunteer was requested to sit quietly in a sofa to undergo the test. The volunteer’s right index fingertip where the spectra were obtained from was stretched into the finger fixation position of the measuring equipment, and completely covered the optical aperture. During the experiment, the contact pressure was remained stable throughout. Measuring time was 15 seconds. After that, the venous blood of volunteer was immediately drawn and analyzed by an automatic blood analyzer to get the reference HB value. At last, spectra of 109 volunteers (23~78 years old; 64 males and 45 females) were obtained.
Fig. 2.
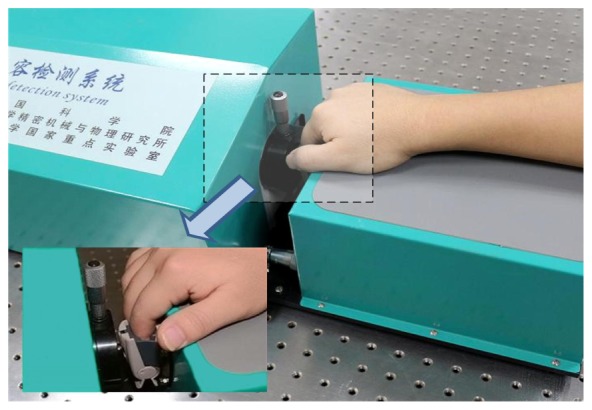
Schematic representation of non-invasive measurement of HB levels by transmittance mode using the NIR spectrophotometric system. Finger fixed device is shown in the inset.
4. Results and discussion
4.1 Elimination of abnormal samples
Occasionally, it is possible that individual sample spectrum data or HB clinical analysis value deviates from the real value due to irregular operation or changing of the measuring environment. Such sample belongs to the abnormal sample. The abnormal samples will seriously affect the prediction precision of NIR model, which should be removed.
In the spectral matrix Xn × m, m refers to wavelength number (m = 16), n refers to the sample number(n = 109), and m<n/2. This kind of spectral data belongs to the category of low dimensional estimators, which is suitable for using minimum covariance determinant estimator to obtain the robust estimates of the center and the scatter matrix of X. After that, abnormal samples were removed based on the robust distances and the Mahalanobis distances. The distance-distance plot is displayed in Fig. 3 . Among the 109 samples, sample No.9, 67, 69, 70 which have great robust distances and Mahalanobis distances, are judged to be abnormal samples and removed. The remaining 105 samples are used to establish model.
Fig. 3.
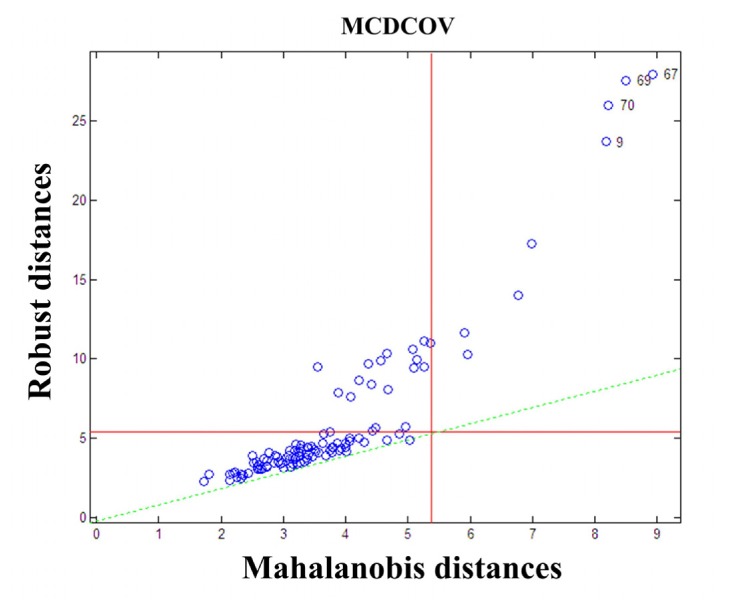
Distance-distance plot of 109 samples.
4.2 Sample sets
A stable model should contain calibration set, correction set and prediction set, which can significantly reduce the appearing probability of correlation by accident. Therefore, we sort the samples according to the gradient of component concentration. And with the ratio of 2:1:1, 53 samples was selected for calibration set, 26 samples was selected for correction set and 26 samples was selected for prediction set. Table 1 shows the distribution of HB concentration.
Table 1. Distribution of HB concentration in sample sets (g/L).
| Overall | Calibration Set | Correction Set | Prediction Set | |
|---|---|---|---|---|
| Maximum | 176 | 176 | 174 | 175 |
| Minimum | 113 | 113 | 114 | 118 |
| Mean | 147.6 | 146.9 | 146.1 | 147.6 |
| Standard deviation | 15.5 | 15.8 | 15.5 | 15.2 |
4.3 Experimental results
Artificial neural network (ANN) is a kind of mathematical model which process information similarly to the structure of brain neural synapses. Due to its excellent nonlinear mapping ability, ANN has been applied in many research fields. Currently, back propagation artificial neural network (BP ANN) is the most widely used algorithm. The topological structure of BP-ANN model is generally consisted of three layers of neurons, including input layer, hidden layer and output layer.
In this article, sigmoid function was used on the hidden layer as activation function; linear transfer function was used on the output layer. Meanwhile, trainscg function was chosen as the training function of the network. On this basis we built a BP-ANN model with three layers of neurons for quantitative analyzing HB concentration. In the model, output was HB concentration, so the number of output layer nodes was 1. The node number choice of input layer and hidden layer is very critical. Too few nodes will affect the degree of convergence and reduce the prediction accuracy. Moreover, more nodes are likely to cause network overtraining, and lead to lower fault-tolerant, although it can enhance the mapping ability of the network model.
The original spectral matrix collected by our instrument was Xn × m(m = 16). If we took 16 absorbance signals as the input of BP-ANN, some redundant variables might be introduced and affect the robustness of the model. In order to eliminate redundant interference, principal component analysis (PCA) was used for reducing dimensions of spectral matrix. Then the optimal principal component could be selected as the inputs of BP-ANN. By adjusting the number of hidden layer nodes, we could optimize the network performance and establish an optimal calibration model.
The scope of hidden layer nodes usually can be confirmed by empirical formula. . In the formula, nl refers to the number of hidden layer nodes, n refers to the number of input layer nodes, m refers to the number of output layer nodes, and a refers to a constant between 1 to 10.
Firstly, we set the scope of input layer nodes (principal component) from 5 to 10. Hence according to the above formula, the scope of hidden layer nodes was about 4~12.
To obtain the optimal node number of input and hidden layers, we established the BP-ANN model of hemoglobin and near infrared spectrum with calibration set and correction set, when number of input layer nodes (principal component) is 5~10 and number of hidden layer nodes is 4~12. Figure 4 shows the relationship among principal component, number of hidden layer nodes and standard error of correction set. Thus it can be seen that the network model get the optimal result when the node number of input, hidden and output layers is 9, 11 and 1.
Fig. 4.
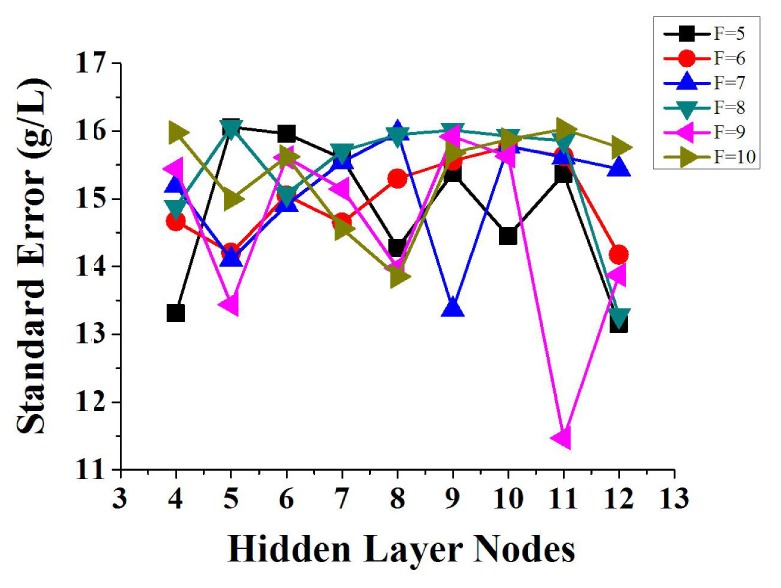
Relationship among principal component, number of hidden layer nodes and standard deviation of correction set. F refers to principal component factors. When F is equal to 9 and the number of hidden layer nodes is 11, the model gets the minimum standard error.
For the optimal BP-ANN model, correlation coefficient of calibration was 0.94, standard error of calibration (SECal) was 11.29g/L, relative SECal was 7.8%, standard error of correction (SECor) was 11.47g/L, and relative SECor was 7.98%. A scatter plot of actual value and analysis value was displayed in Fig. 5(a) . Furthermore, for examining the adaptive capacity of the optimal BP-ANN model, prediction set was used and hemoglobin value of the set was predicted, as shown in Fig. 5(b). Correlation coefficient of prediction was 0.73, standard error of prediction (SEP) was 11.01g/L, and relative SEP was 7.41%.
Fig. 5.
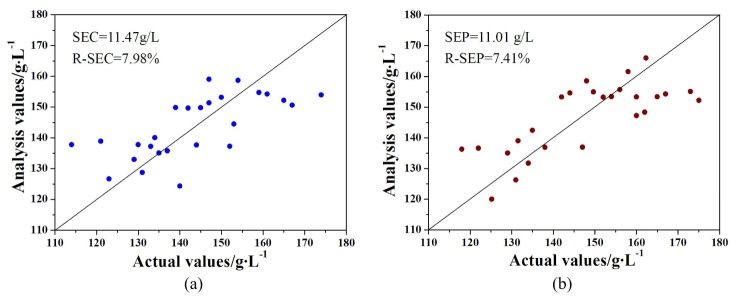
A scatter diagram showing comparison of the actual and analysis HB values. (a) Correction set. (b) Prediction set.
The results indicated that robustness of the BP-ANN model optimized by PCA is high because the spectra of 3 sample sets all showed good correlation with HB value, in addition, relative analytical errors were all under 8% and with similar levels. It was illustrated that, we were able to initial realize non-invasive detecting of HB value by using array NIR spectrophotometric system developed in this paper and optimized BP-ANN model, and the overall accuracy was close to the level of clinical application. However, several samples were predicted to have a high deviation especially when the actual HB value was low. The reason for this problem is various, strong light scattering of human tissues might be an important factor. This will be the next portion we need to improve.
5. Conclusions
Recent advances in non-invasive prediction of human HB by NIR have meant that this technology has good prospect in clinical application. We adopted a broadband light source composed of 9 LEDs, matched with a plane grating spectrograph and a Si photodiode array, and developed a non-invasive human HB detection system. PCA combined with BP-ANN were used for establishing three layers network model, with which spectra of 3 sample sets were analyzed. The analysis results initially confirm that the method can realize the non-invasive detection of human HB value; also the accuracy and adaptability are satisfactory. But from a technical point of view, the research still has some defects, and there is certainly room for improvement. In future, we will strengthen research on suppression method of scatter interference, and continue to subdivide subjects in the age, gender, etc. In such a way, it is expected to get a better result and achieve wide clinical application of the technology.
Acknowledgments
We are grateful for continued financial support from National Natural Science Foundation of China (61308067), the National High Technology Research and Development Program of China (2012AA022602), and the fund of State Key Laboratory of Applied Optics of China (Y2Q03FQZ01).
References and links
- 1.Worldwide prevalence on anaemia 1993-2005”, http://www.who.int/vmnis/database/anaemia/ anaemia_status_summary/en/index.html
- 2.P. Williams and K. Norris, Near-Infrared technology in the agricultural and food industries, Second Edition ed. (American Association of Cereal Chemists, Inc., 2001). [Google Scholar]
- 3.Moron A., Cozzolino D., “Application of near infrared reflectance spectroscopy for the analysis of organic C, total N and pH in soils of Uruguay,” J. Near Infrared 10(1Spec.), 215–221 (2002). 10.1255/jnirs.338 [DOI] [Google Scholar]
- 4.Arnold M. A., Small G. W., “Noninvasive glucose sensing,” Anal. Chem. 77(17), 5429–5439 (2005). 10.1021/ac050429e [DOI] [PubMed] [Google Scholar]
- 5.Yamakoshi K., Yamakoshi Y., “Pulse glucometry: a new approach for noninvasive blood glucose measurement using instantaneous differential near-infrared spectrophotometry,” J. Biomed. Opt. 11(5), 054028 (2006). 10.1117/1.2360919 [DOI] [PubMed] [Google Scholar]
- 6.Sakudo A., Kato Y. H., Tajima S., Kuratsune H., Ikuta K., “Visible and near-infrared spectral changes in the thumb of patients with chronic fatigue syndrome,” Clin. Chim. Acta 403(1-2), 163–166 (2009). 10.1016/j.cca.2009.02.010 [DOI] [PubMed] [Google Scholar]
- 7.Lu Q. P., Chen C., Peng Z. Q., “[Application of adaptive filter to noninvasive biochemical examination by near infrared spectroscopy],” Optics and Precision Engineering 20(4), 873–879 (2012). 10.3788/OPE.20122004.0873 [DOI] [Google Scholar]
- 8.Gao H. Z., Lu Q. P., Ding H. Q., Chen S. W., “[Improvement of model performance for near-infrared non-invasive biochemical analysis by pathlength correction space method],” Optics and Precision Engineering 21(8), 1974–1980 (2013). 10.3788/OPE.20132108.1974 [DOI] [Google Scholar]
- 9.H. M. Heise, “Glucose Measurements by Vibrational Spectroscopy,” in Handbook of Vibrational Spectroscopy (John Wiley & Sons, Ltd, 2006). [Google Scholar]
- 10.K. Norris, “Making light work: Advances in near infrared spectroscopy “in Possible medical applications of NIR (Murray I & Cowe I A. UK: Ian Michael Publication, 1992), pp. 596-602. [Google Scholar]
- 11.Kuenstner J. T., Norris K. H., “Near infrared hemoglobinometry,” J. Near Infrared 3(1Spec.), 11–18 (1995). 10.1255/jnirs.50 [DOI] [Google Scholar]
- 12.Kumar G., Schmitt J. M., “Optimum wavelengths for measurement of blood hemoglobin content and tissue hydration by NIR spectrophotometry,” Proc. SPIE 2678, 442–453 (1996). 10.1117/12.239533 [DOI] [Google Scholar]
- 13.Zhang S., Soller B. R., Kaur S., Perras K., Salm T. J. V., “Investigation of noninvasive in vivo blood hematocrit measurement using NIR reflectance spectroscopy and partial least-squares regression,” Appl. Spectrosc. 54(2), 294–299 (2000). 10.1366/0003702001949258 [DOI] [Google Scholar]
- 14.Pothisarn W., Chewpraditkul W., Yupapin P. P., “A non-invasive hemoglobin measurement based pulse oximetry,” Proc. SPIE 4916, 498–504 (2002). 10.1117/12.483014 [DOI] [Google Scholar]
- 15.Dullenkopf A., Lohmeyer U., Salgo B., Gerber A. C., Weiss M., “Non-invasive monitoring of haemoglobin concentration in paediatric surgical patients using near-infrared spectroscopy,” Anaesthesia 59(5), 453–458 (2004). 10.1111/j.1365-2044.2004.03665.x [DOI] [PubMed] [Google Scholar]
- 16.Saigo K., Imoto S., Hashimoto M., Mito H., Moriya J., Chinzei T., Kubota Y., Numada S., Ozawa T., Kumagai S., “Noninvasive Monitoring of Hemoglobin. The Effects of WBC Counts on Measurement,” Am. J. Clin. Pathol. 121(1), 51–55 (2004). 10.1309/61ANJ1XV3MW878YP [DOI] [PubMed] [Google Scholar]
- 17.Park Y. H., Lee J. H., Song H. G., Byon H. J., Kim H. S., Kim J. T., “The accuracy of noninvasive hemoglobin monitoring using the radical-7 pulse CO-Oximeter in children undergoing neurosurgery,” Anesth. Analg. 115(6), 1302–1307 (2012). 10.1213/ANE.0b013e31826b7e38 [DOI] [PubMed] [Google Scholar]
- 18.Shah N., Osea E. A., Martinez G. J., “Accuracy of noninvasive hemoglobin and invasive point-of-care hemoglobin testing compared with a laboratory analyzer,” Int. J. Lab. Hematol. 36, 56–61 (2013). [DOI] [PMC free article] [PubMed] [Google Scholar]
- 19.Lamhaut L., Apriotesei R., Combes X., Lejay M., Carli P., Vivien B., “Comparison of the Accuracy of Noninvasive Hemoglobin Monitoring by Spectrophotometry (SpHb) and HemoCue® with Automated Laboratory Hemoglobin Measurement,” Anesthesiology 115(3), 548–554 (2011). 10.1097/ALN.0b013e3182270c22 [DOI] [PubMed] [Google Scholar]


