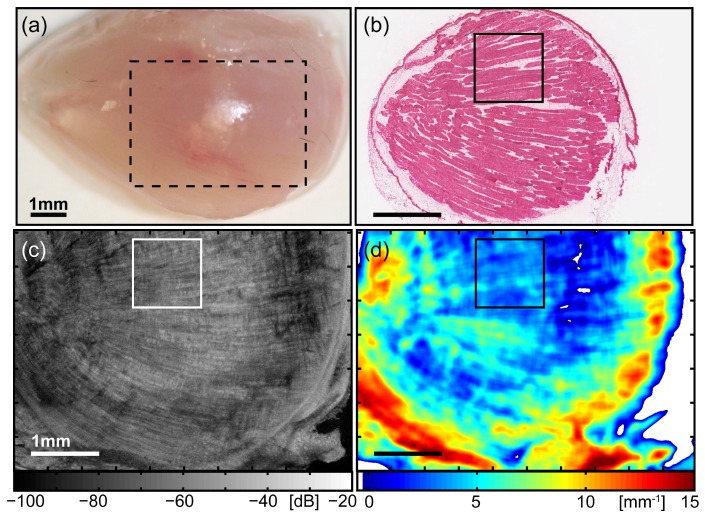
Fig. 1.
Images of healthy skeletal muscle tissue, obtained from the tibialis anterior of a wild-type C57Bl/10ScSn mouse. (a) Photograph of the anterior surface of the muscle, indicating the lateral area (x-y) over which the subsequent 3D-OCT data set was obtained (dashed outline). For clarity, this image is scaled × 2 compared to the following images (b) – (d). (b) Co-registered H&E-stained histology identifying tissue morphology. (c) En face (x-y) OCT image at depth z = 350 µm from the imaging glass-window / tissue interface. (d) Parametric map of attenuation coefficients µt(x,y). Points with µt < 0 are masked white. The outlined region in images (b) – (d) indicates the ROI selected for subsequent comparison and quantitative analysis. All scale bars 1 mm.

