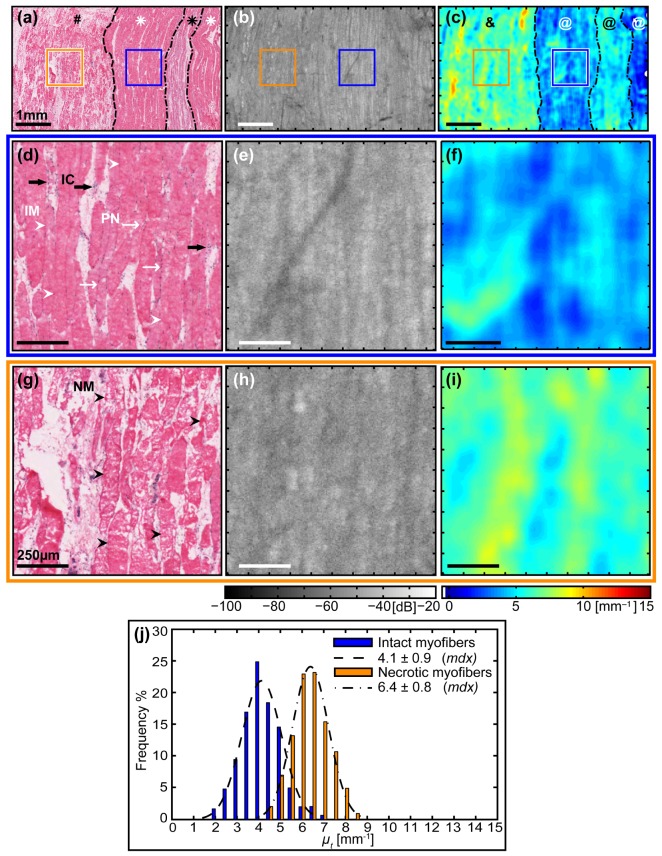
Fig. 5.
Quantitative comparison of the attenuation coefficients from two different regions, intact myofibers versus necrotic myofibers without inflammatory cells, from within the same sample of dystrophic skeletal muscle tissue. (a) – (c) Top row: Large-scale images of the muscle sample (symbols described in the text). Scale bars 1 mm. (d) – (f) Middle row (blue outline): Zoomed images of intact myofibers. Scale bars 250 µm. (g) – (i) Bottom row (orange outline): Zoomed images of necrotic myofibers without the presence of inflammatory cells. Scale bars 250 µm. (a), (d) & (g) Co-registered H&E-stained histology indicating biological features of interest: (d) intact myofibers (IM, white arrowheads), peripheral nuclei (PN, thin white arrows), and inflammatory cells (IC, thick black arrows); (g) necrotic myofibers (NM, black arrowheads). (b), (e) & (h) En face (x-y) OCT images. (c), (f) & (i) Parametric maps of attenuation coefficients µt(x, y). (j) Histogram of attenuation coefficients µt for intact myofibers (blue) versus necrotic myofibers (without inflammatory cells) with an associated normal distribution fitted using the mean ± standard deviation calculated from each ROI.

