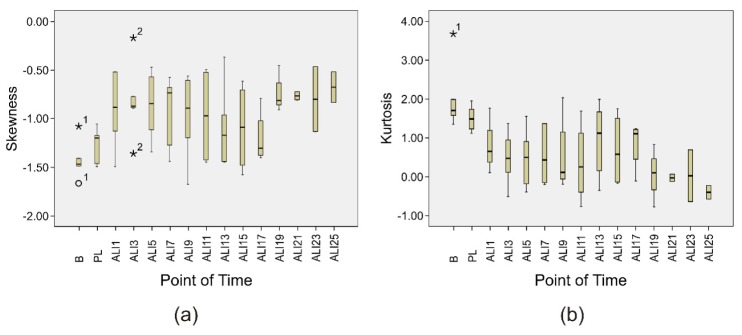
Fig. 6.

Boxplots describing the course of (a) Skewness and (b) Kurtosis over the measurement points. The outliers are identified with the number of the corresponding animal (“o” and “*” stand for mild (between 1.5 and 3x interquartile range) and extreme (>3x interquartile range) outliers, respectively).
