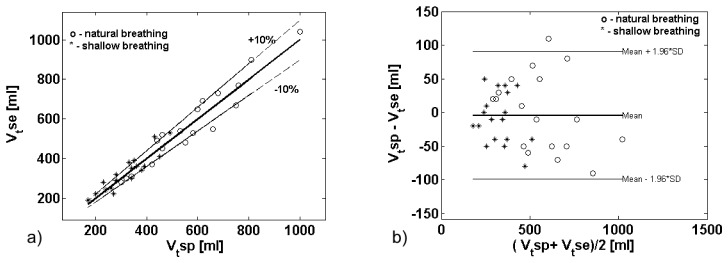
Fig. 5.

a) Identity plot of mean Vt recorded by sensors vs. the corresponding values measured by spirometer for each of 18 healthy volunteers for natural breathing (o) and shallow breathing (*). b) Bland-Altman plot of difference in mean Vt measured by the two methods. The middle line represents the mean difference between these two methods (bias) and the outer lines represent 95% limits of agreement ( ± 1.96 std of bias)
