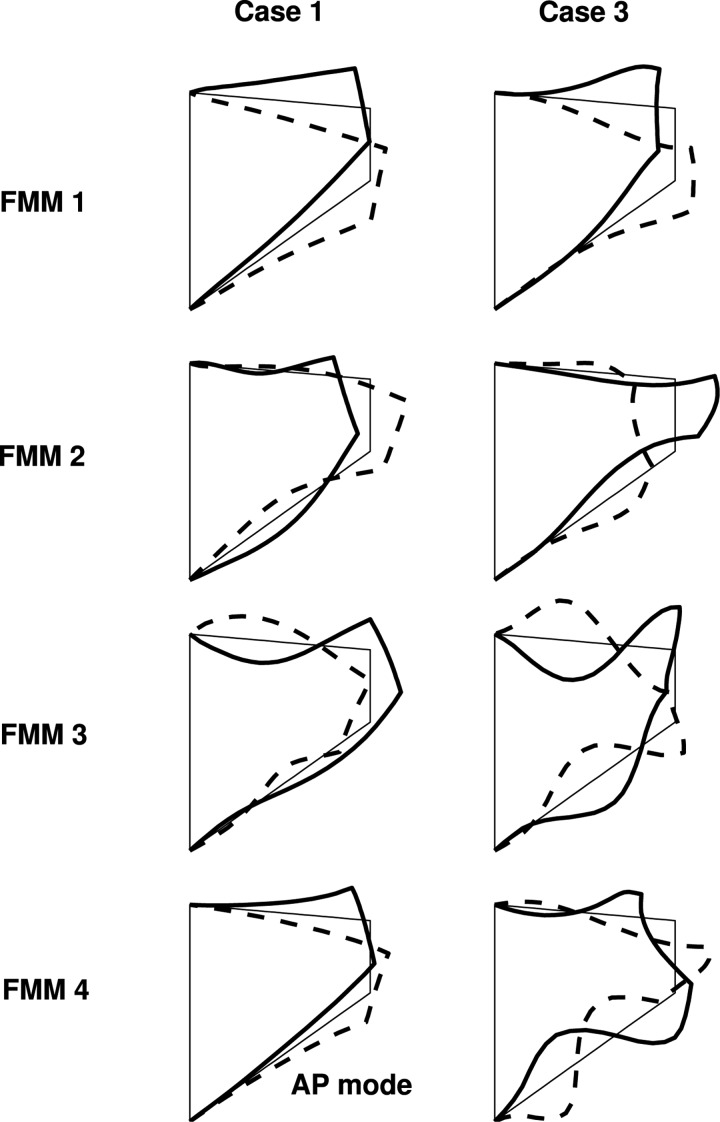
Figure 2.
The first four in vacuo FM modes of the vocal fold model in cases 1 and 3. In each plot, the thick solid line and the dashed line indicate extreme positions of the corresponding mode, spaced 180° apart in a vibratory cycle, and the thin solid line indicates equilibrium positions. The AP modes indicate modes exhibiting out-of-phase medial-lateral motion along the AP length.

