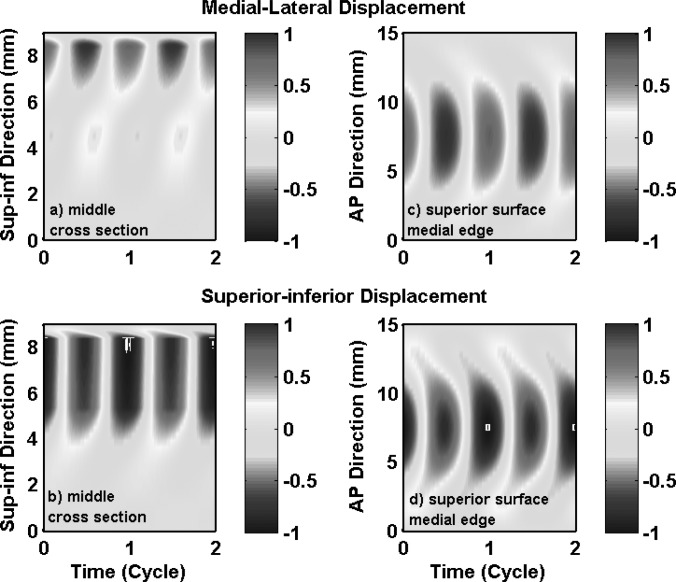
Figure 9.
(Color online) Case 4: two-layer transversely isotropic model with strong anisotropy in the body layer. Spatiotemporal plot of the medial-lateral (a) and superior-inferior (b) components of the vocal fold surface displacement in the middle cross-section as a function of the vertical location along the superior-inferior direction and time, and the spatiotemporal plot of the medial-lateral (c) and superior-inferior (d) components of the vocal fold surface displacement along the superior edge of the medial surface as a function of the AP location and time. The displacements were normalized by the maximum value of the two components (medial-lateral and superior-inferior) along the entire vocal fold surface.

