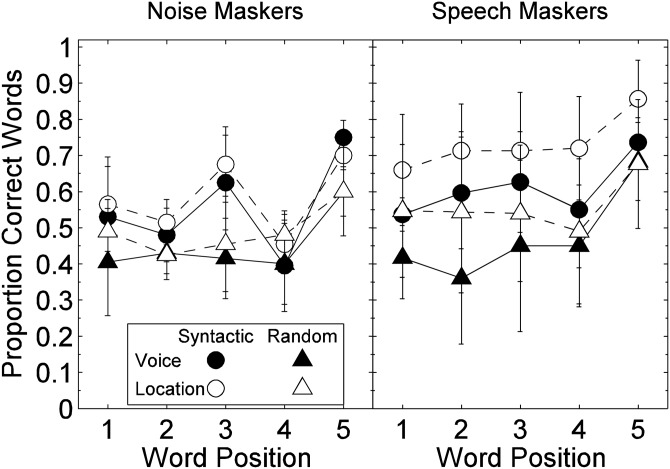
Figure 4.
Group mean proportion correct and standard errors of the means plotted as a function of word position from experiment 1A. The left panel displays the results from the noise maskers and the right panel displays the results from the speech maskers. The values were averaged across T/Ms from the middle portions of the functions in Fig. 2 (see text). The filled symbols are the results when the target designator was voice while the open symbols are the results when the target designator was location. Circles show syntactic target results while triangles are for random target sentences.

