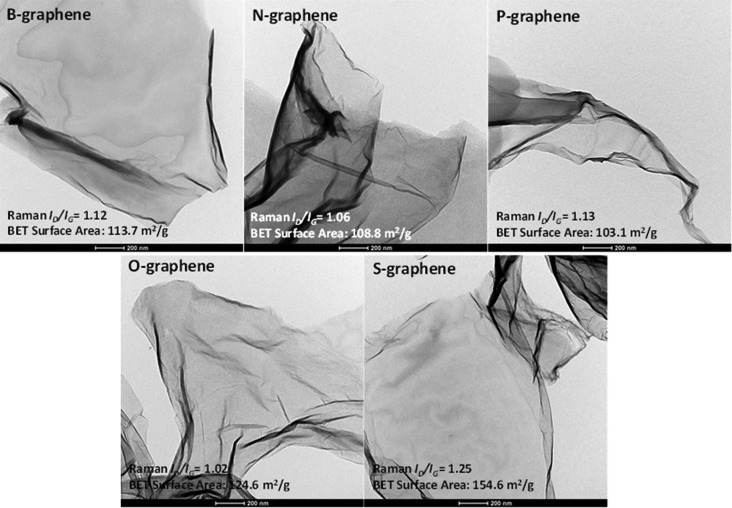
Figure 1.
TEM images of various single-doped graphene samples. The inset values represent the ID/IG ratios and the specific surface areas obtained from Raman spectra and nitrogen adsorption isotherms, respectively for each sample (see Figures S1 and S2, SI for details).

