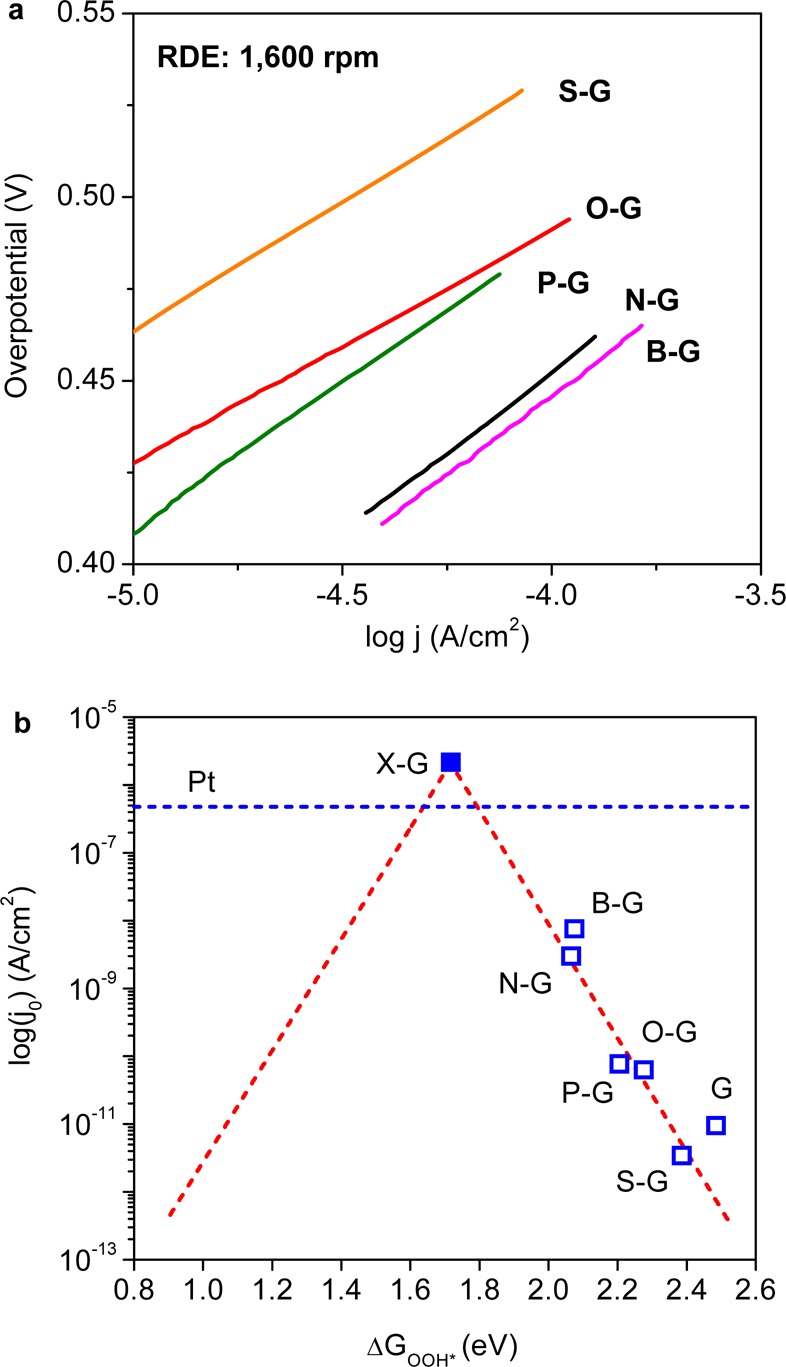
Figure 4.

(a) Experimentally determined Tafel plots for different catalysts from ORR polarization curves shown in Figure S3, SI, data were collected at RDE = 1600 rpm. (b) Volcano plot between j0theory and ΔGOOH* with charge-transfer coefficient α = 0.5 (red dashed line). Blue hollow squares are j0expt obtained from Tafel plots and DFT-derived ΔGOOH* for each doped graphene catalyst. ΔGOOH* for X-graphene (blue solid square) was obtained from eq S4e, SI and its j0theory was obtained from eq 10. The j0expt value for Pt was also shown by the blue dashed line as a reference.
