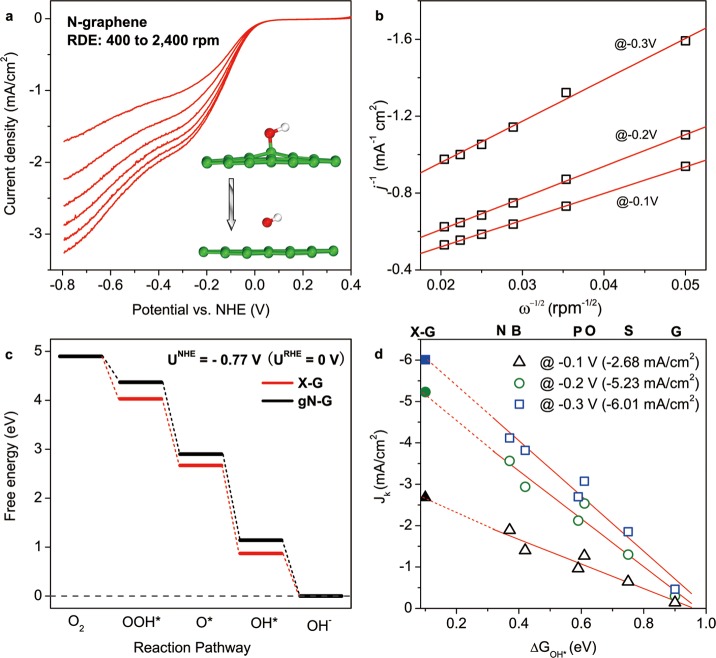
Figure 7.
(a) Electrochemically measured LSV of N-graphene catalyst at different rotating speeds in an O2-saturated 0.1 M solution of KOH. Inset illustrates the last electron transfer step: OH* desorption to generate OH–. (b) Koutecky–Levich plots for N-graphene at −0.3 V, −0.2 V, and −0.1 V vs NHE, data were collected from panel a. (c) Potential corrected free energy diagram for gN-G and X-graphene models at URHE = 0 V (UNHE = −0.77 V). (d) The relationship between ΔGOH* and jK for various synthesized graphene catalysts under different potentials (open symbols), data were collected from Figure S3, SI. The values in parentheses of the legend are jK values for X-graphene, which are predicted by extending the fitted lines to ΔGOH* = 0.10 eV, shown as closed symbols.

