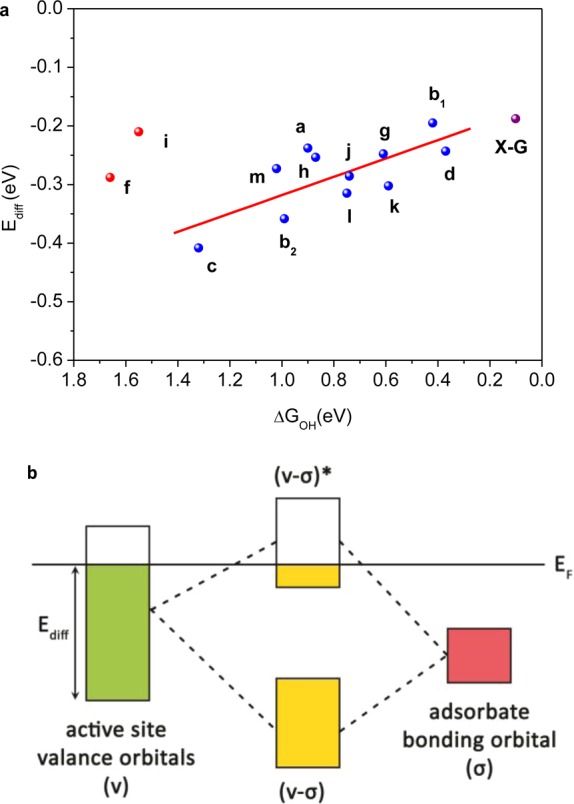
Figure 8.

(a) The relationship between ΔGOH* and Ediff; data were collected for the most active site of various doped graphene models and labeled according to the corresponding molecular configurations shown in Figure S6, SI. Red points were not considered in the line fitting. The prediction of X-graphene is shown as pink point. (b) Scheme of orbital hybridization of valence band from active sites and adsorbates bonding orbital. EF refers to highest valence orbital energy of the entire graphene cluster.
