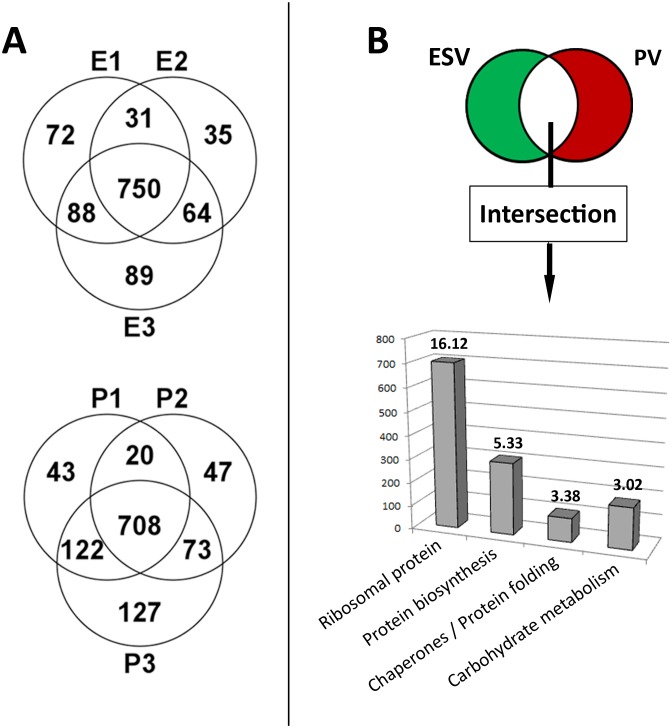
Figure 2. Reproducibility of biological triplicates and annotation clustering of intersection.
A) VENN diagrams for ESV (E1, E2, E3) and PV (P1, P2, P3) mass spectrometry datasets (total n = 1281). ESV datasets (A, top) n = 1129 with overlaps. 750 proteins (66%) were detected in all three datasets. PV datasets (A, bottom) n = 1140 with overlaps. 708 proteins (62%) were detected in all three datasets. B) Clustering analysis of 1059 proteins defined by the E1-E3 and P1-P3 data intersection (see Figures S1 and S2) using the DAVID bioinformatics tool [34]. X-axis: functional clusters with an enrichment score above 3; y-axis: number of proteins; value in bold on top of column: enrichment score. A detailed summary of all 14 clusters can be found in the Text S2 and S3.

