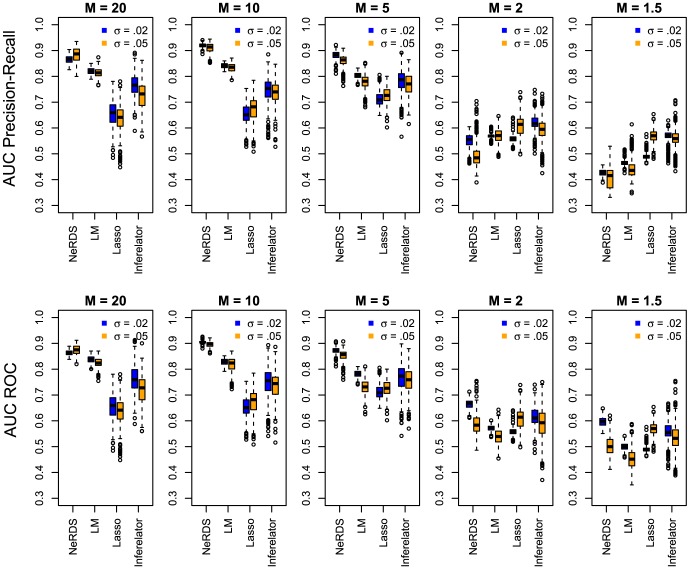
Figure 4. Performance evaluation on the Lactocaccus Lactis system.
Upper row: Boxplots showing area under the precision-recall curves from 500 Monte Carlo simulations reconstructing the Lactocaccus network. Bottom Row: Boxplots showing area under the ROC curves. Each plot in the row corresponds to a different value of the perturbation parameter  (high to low from left to right). Within each plot, boxplots are arranged according to reconstruction method; from left to right these are: additive ODEs (NeRDS), linear ODEs (LM), linear ODEs plus a Lasso penalty (Lasso), and Inferelator. For each method a pair of boxplots are presented corresponding to low noise (
 , left) and moderate noise (
 , right).

