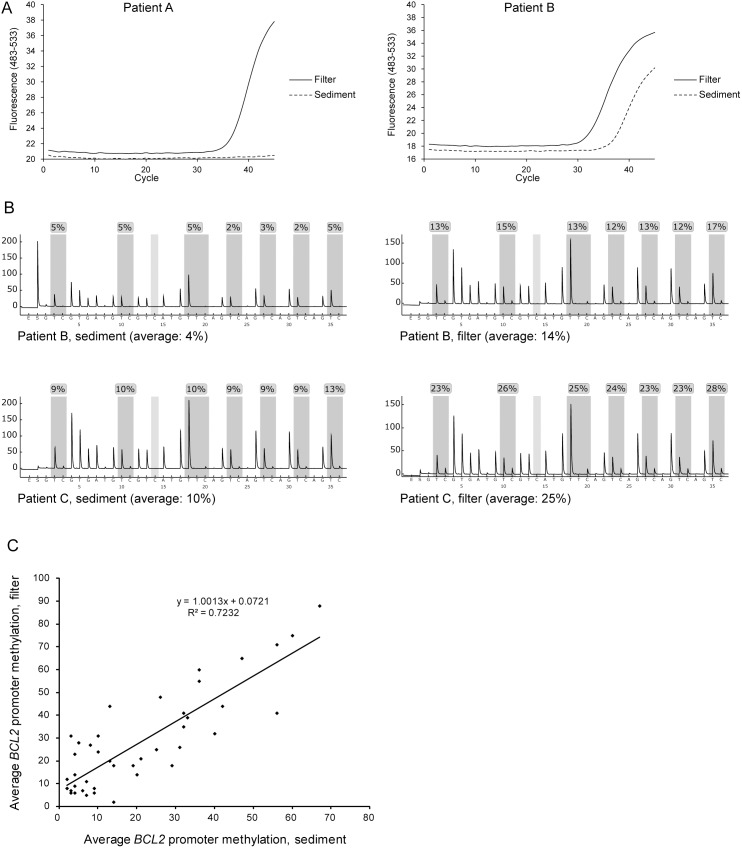
Figure 3. Analysis of tumor-derived DNA in paired urine samples (sediment and filter) from bladder cancer patients.
(A) Examples of MethyLight analysis of BCL2 promoter CpG island methylation. In patient A, amplification is seen in the filter sample but not in the sediment sample. In patient B, amplification is seen in both samples; however with a higher Ct value for the sediment sample. (B) Examples of BCL2 promoter CpG island methylation analysis by pyrosequencing in paired samples. Average methylation level is calculated for the seven individual CpG sites assayed (indicated by dark grey shading). The average methylation level in the sediment sample from patient B was below the background signal for pyrosequencing, in contrast to the MethyLight assay (A), showing the difference in analytical sensitivity between the two assays. (C) Average methylation levels for paired samples as determined by pyrosequencing. Shown are the results for cases where at least one of the paired samples showed signals above the background for pyrosequencing (N = 42).

