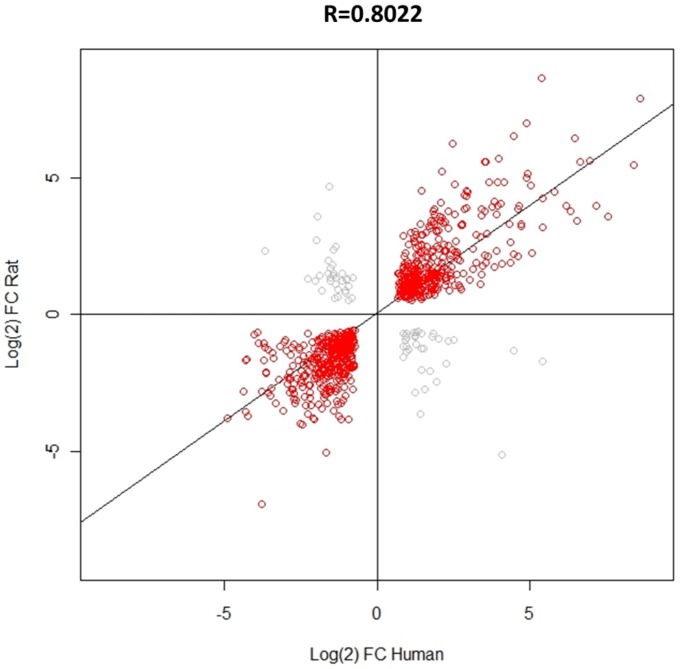
Figure 3. Correlation of human and rat UVB-induced gene expression.
Using only those genes which were significantly dysregulated in both human and rat, the Pearson's correlation coefficient (r = 0.8022) showed that, overall there was a positive correlation in FC values. This correlation was highly significant (p<0.001), n = 841 genes in total. A minority of genes did however show an opposite pattern of regulation between species, shown in grey.

