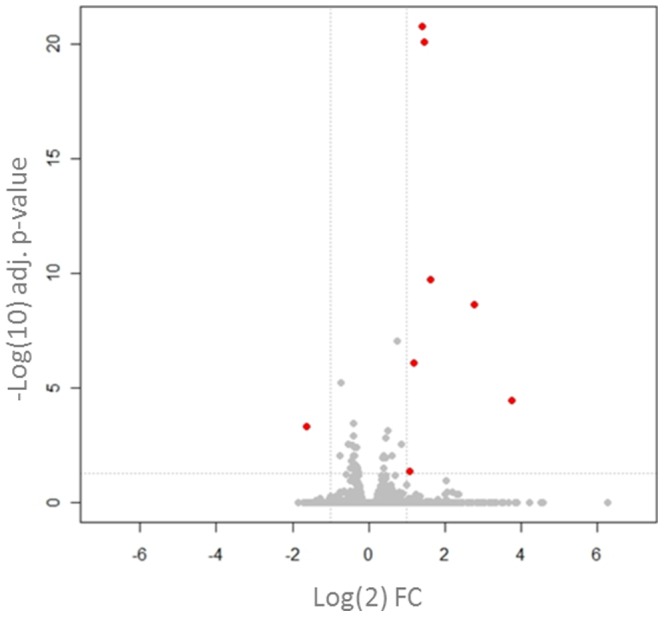
Figure 5. Transcriptional changes in the DRG of the rat UVB model.

The volcano plot compares the transcriptional FC (x-axis) of the genes analysed and their level of significance (y-axis). In contrast to the skin, very few significant changes were detected in the DRG 48 hours after UVB irradiation. Those which were significant and had a >2 FC are highlighted in red. FC = UVB/control, n = 8. Adjusted p-values calculated with FDR.
