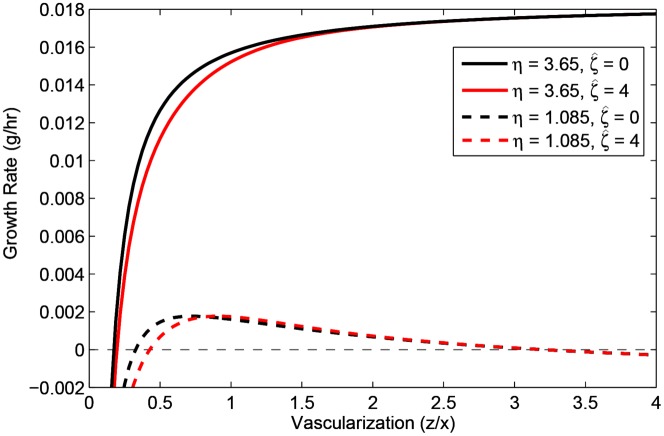
Figure 7. Per capita growth rate of various strategies against tumor vascularization.
Gray, dashed horizontal line represents zero growth rate. Solid lines represent clones with high proliferation commitment ( = 3.65 min−1), while dashed lines represent clones with low proliferation commitment (
 = 1.085 min−1). Black lines represent the lowest angiogenic clones (
 = 0 min−1), red lines; the highest angiogenic clones (
 = 4 min−1), which encompasses the possible curves of all intermediate angiogenic clones.

