
Figure 8. Dynamics of the Shannon diversity index,  , of individual tumors evolving in angiogenic commitment (
 ) for two different constant proliferation commitments: (A)
  min−1; (B)
  min−1.
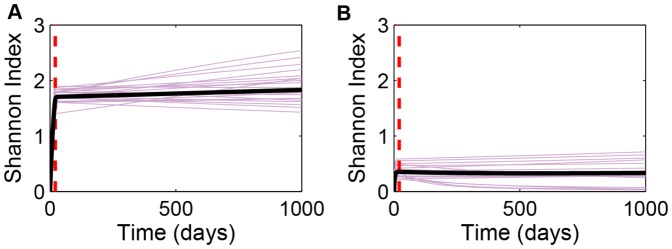
Purple curves in both panels represent the first 20 of the 1000 simulations plotted in Fig. 5. Solid black curves are the ensemble averages of all 1000 runs. Dashed red lines represent mean time of the final mutation ( ), with
  .
.