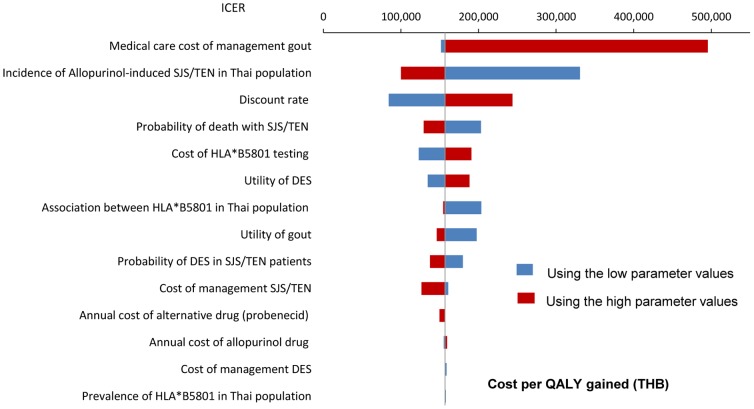
Figure 3. Tornado diagram showing a series of one-way sensitivity analyses comparing genetic testing and usual care.
The horizon bars represent the range of the incremental cost-effectiveness ratio (ICER) for one-way sensitivity over the range of parameters. The wider the horizon bar, the more uncertainty that parameter introduces. The vertical line represents the base-case ICER. X-axis indicated the ICER. THB = Thai baht. The low and high parameter values are based on the range specified in Table 1.

