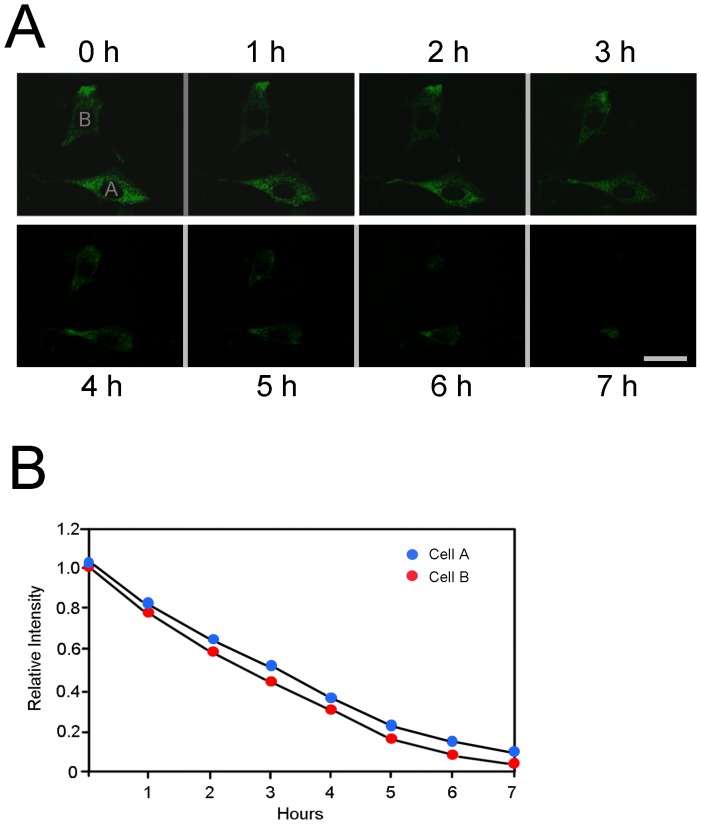
Figure 4. Photoactivation of myocilinWT-PAGFP.
A. Human TM cells transfected with expression vector myocilinWT-PAGFP were imaged using 488-nm excitation. Selected cells were irradiated by 405-nm light. Green fluorescence, representing myocilin-GFP, was seen distributed in the entire cell upon irradiation. The field was monitored for 24 h and the fluorescence intensity at various time points was qualified by Image J. Images of two representative cells (cell A and cell B that displayed low intensity of green fluorescence) at time points 0, 1, 2, 3, 4, 5, 6, and 7 h are shown. B. The fluorescence intensity of myocilinWT-GFP in cells A and B was plotted against time to estimate the myocilinWT-GFP half-life.

