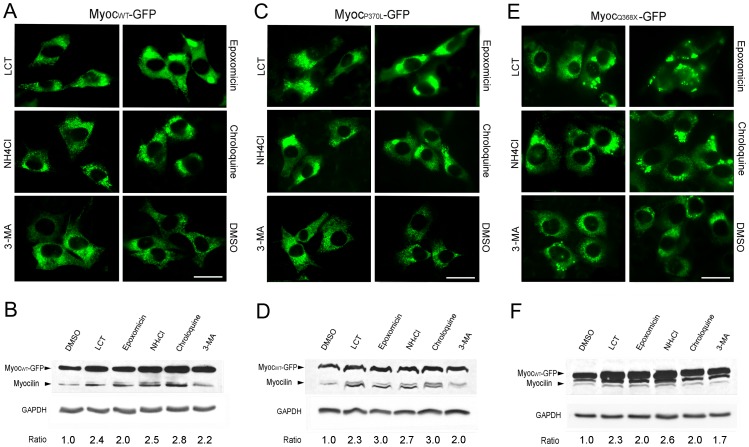
Figure 6. Effects of inhibitors on levels of expressed myocilin-GFP in inducible cells.
Fluorescence images of myocilinWT-GFP (MyocWT-GFP, A), myocilinP370L-GFP (MyocP370L-GFP, C), myocilinQ368X-GFP (MyocQ368X-GFP, E)-expressing-RGC5 cells treated with various inhibitors are shown. Scale bar, 20 µm. For Western blotting, RGC5 cells induced by Dox for 24 h to express myocilinWT-GFP (B), myocilinP370L-GFP (D), and myocilinQ368X-GFP (F) were treated for 16 h with vehicle DMSO, or proteasomal (LCT and epoxomicin), lysosomal (NH4Cl and chloroquin) or autophagic (3-MA) inhibitors. Proteins (25 µg) in cell lysates were immunoblotted with anti-myocilin or anti-GAPDH. Protein bands for the endogenous myocilin (55/57 kDa) and myocilin-GFP (∼100 kDa) were seen. Densitometry was performed. The myocilin-GFP/GAPDH relative to the DMSO control ratios are presented. All experiments were repeated at least 3 times.

