
Figure 8. LC3 levels in inducible cells.
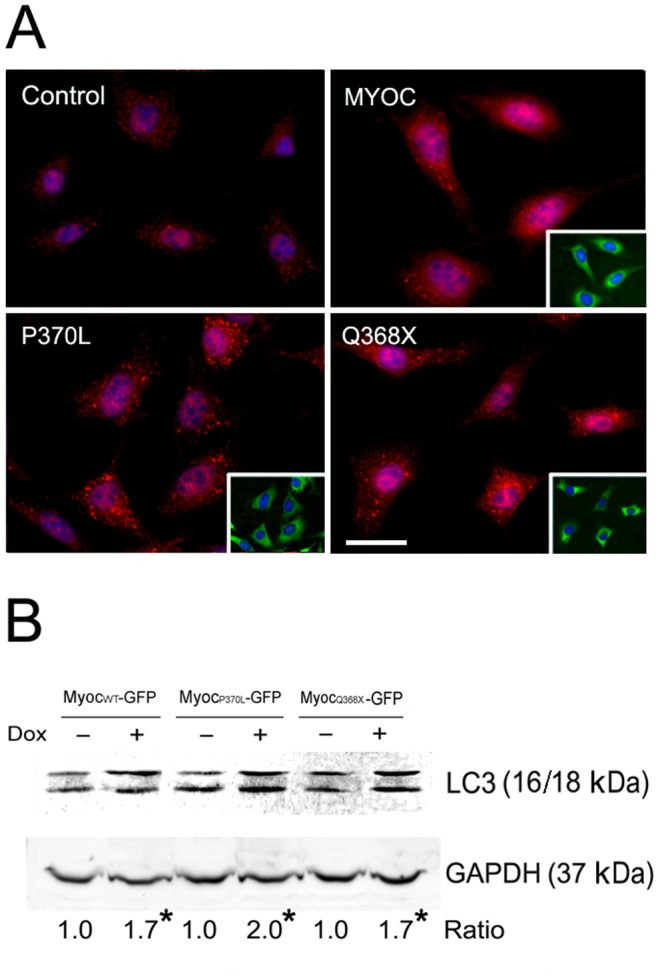
A. LC3 immunostaining (in red) in inducible, stable RGC5 cells. The cells were induced by Dox for 24 h to express myocilinWT-GFP (MYOC), myocilinP370L-GFP (P370L), or myocilinQ368X-GFP (Q368X). The fusion protein-expressing, green fluorescent cells are shown in insets. There was no green fluorescence, as expected, in non-induced (control) cells. Note an increased LC3 staining intensity in myocilin-GFP-expressing green cells compared with non-induced cells. Scale bar, 10 µm. B. Western blotting for LC3 protein level. RGC5 cells were induced for 24 h to express myocilinWT (MyocWT)-, myocilinP370L (MyocP370L)-, or myocilinQ368X (MyocQ368X)-GFP. Total cell lysate was subject to SDS-PAGE and immunoblotting using anti-LC3 or anti-GAPDH. Both LC3-I and LC3-II protein bands were detected. The LC3/GAPDH ratios in induced cells relative those of non-induced controls are presented. *, P<0.0046 compared to non-induced controls. All experiments were repeated at least 3 times, yielding similar results.