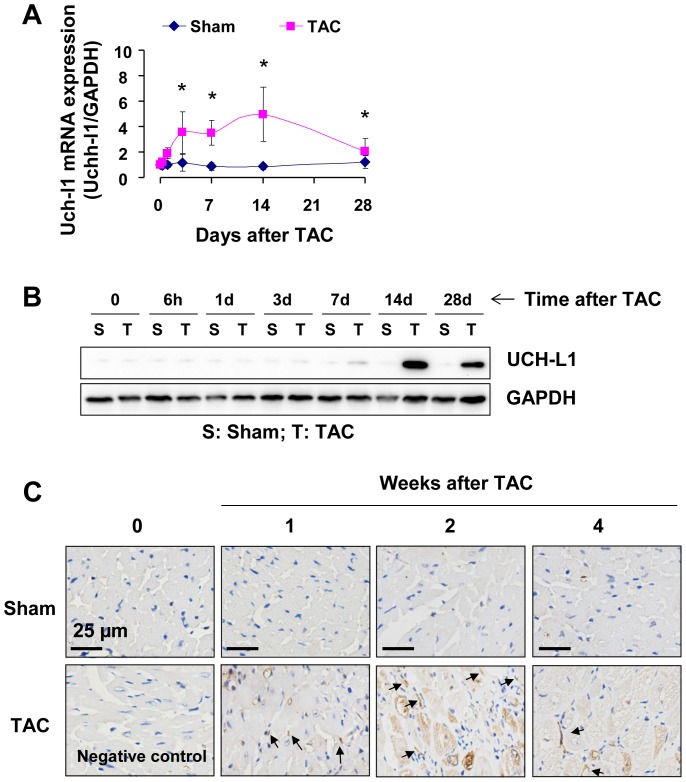
Figure 1. Expression of UCH-L1 in the heart after TAC.
A. UCH-L1 mRNA expression in the left ventricles of mice after sham and TAC. n = 6, *p<0.05 vs. sham controls. B. Western blot analysis of UCH-L1 expression in the left ventricles of mice after sham and TAC. n = 3. C. UCH-L1 staining in the left ventricles of mice after sham and TAC. The results are representatives of 4 separated experiments.

