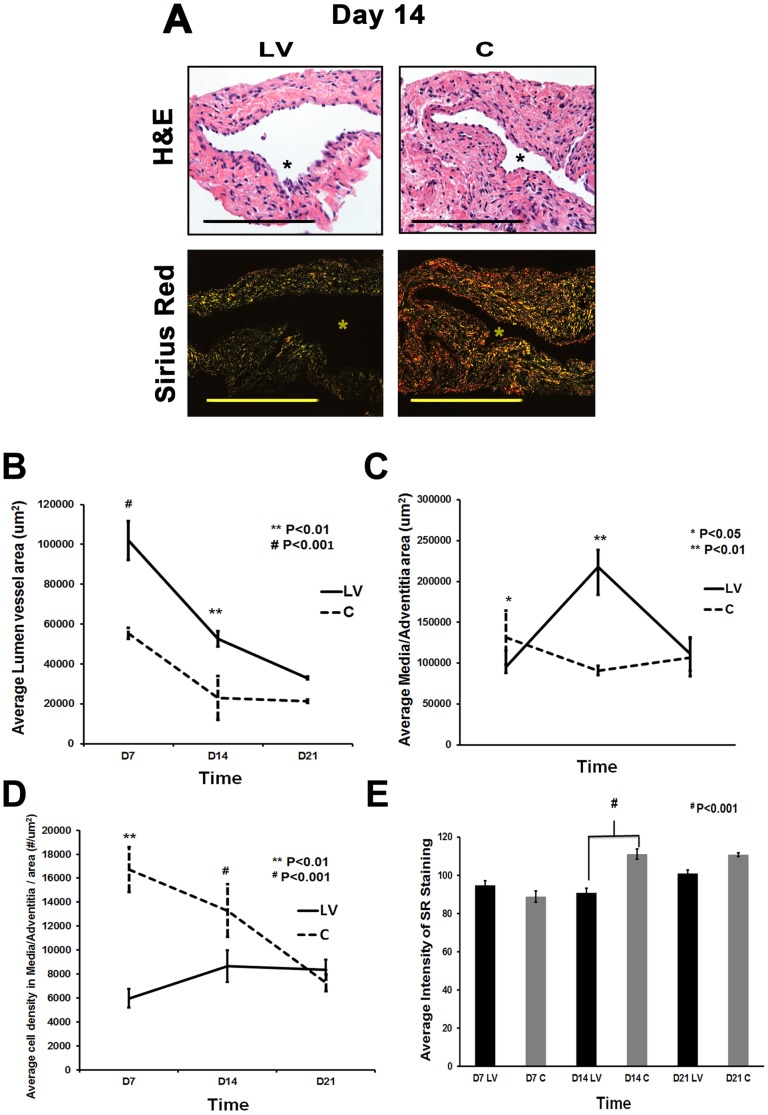
Figure 2. Hematoxylin and eosin (H&E) and picrosirius red staining of LV-shRNA-ADAMTS-1 transduced vessels have increased lumen vessel area with decreased collagen expression.
A) Upper panel is representative sections after hematoxylin and eosin (H&E) at the venous stenosis of the LV-shRNA-ADAMTS-1 (LV) and control shRNA (C) transduced vessels at day at day 14 showing increase in lumen vessel area. A) Lower panel is representative polarized light microscopy of picrosirius red-stained venous stenosis showing decreased fibrosis (collagen fibers are bright yellow) of the LV and C transduced vessels. Pooled data for the average lumen vessel area of the LV and C groups at day 7 (D7), 14 (D14), and 21 (D21) are shown in B). There is a significant increase in the average lumen vessel area in the LV transduced vessels when compared to C vessels for day 7 (P<0.001) and day 14 (P<0.01). Pooled data for average area of the media and adventitia for LV and C groups at day 7 (D7), 14 (D14), and 21 (D21) are shown in (C). By day 7, there is a significant increase in the average area of the media and adventitia in the LV transduced vessels when compared to C vessels (P<0.05). By day 14, the average area of the media and adventitia is significantly increased in the LV transduced vessels when compared to C vessels (P<0.01). Pooled data for the average cell density in the media and adventitia in the LV and C groups at day 7 (D7), 14 (D14), and 21 (D21) are shown in (D). There is a significant decrease in average cell density in the media and adventitia in the LV transduced vessels when compared to C vessels for day 7 (P<0.01) and day 14 (P<0.001). Pooled data for average intensity of picrosirius red staining of the vessel wall for LV and C groups at day 7 (D7), 14 (D14), and 21 (D21) are shown in (E). There is a significant decrease in average intensity of picrosirius red staining of the vessel wall of LV transduced vessels when compared to C vessels for day 14 (P<0.001). All are 40X. Scale bar is 50-μM. * Indicates the lumen. Each bar shows mean ± SEM of 4-6 animals per group (B-E). Two-way ANOVA followed by Student t-test with post hoc Bonferroni's correction was performed. * P<0.05, ** P<0.01, or # P<0.001.

