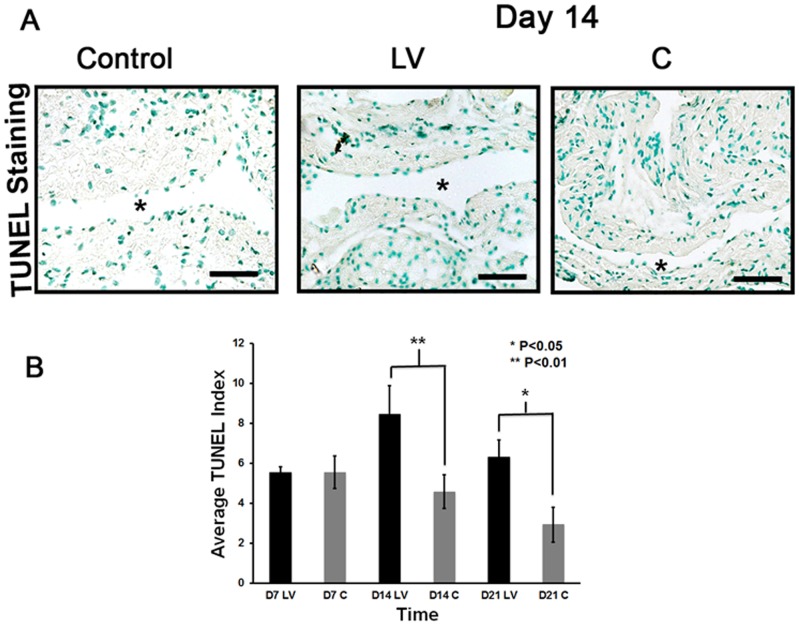
Figure 4. Apoptosis is increased in the LV-shRNA-ADAMTS-1 transduced vessels.
A) is a representative section from TUNEL staining at the venous stenosis of the LV-shRNA-ADAMTS-1 (LV) and control shRNA(C) transduced control vessels at day 14. Nuclei staining brown are positive for TUNEL. Negative control is shown where the recombinant terminal deoxynucleotidyl transferase enzyme was omitted. All are 40X. Scale bar is 50-μM. * Indicates the lumen. Arrow indicates TUNEL positive cells. Pooled data for LV and C transduced vessels for TUNEL index at the outflow vein of the LV and C transduced vessels at day 7 (D7), 14 (D14), and 21 (D21) is shown in (B). This demonstrates a significant increase in the mean TUNEL index at day 14 (P<0.01) and day 21 (P<0.05) in the LV group when compared to C. Each bar shows mean ± SEM of 3–6 animals per group. Two-way ANOVA followed by Student t-test with post hoc Bonferroni's correction was performed. Significant difference from control value was indicated by *P<0.05 or **P<0.01.

