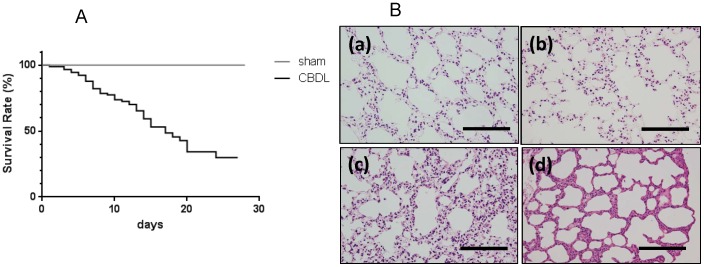
Figure 1. Survival curves and histological changes in common bile duct ligated (CBDL) mice and sham operated mice.
(A) Kaplan-Meier survival curve in common bile duct ligated (CBDL) mice (n = 44) and sham operated (control) mice (n = 41). (B) HE-stained lung sections of sham and CBDL mice: (a) sham; (b) 1 week after CBDL; (c) 2 weeks after CBDL; (d) 3 weeks after CBDL (×20). Scale bar = 100 µm.

