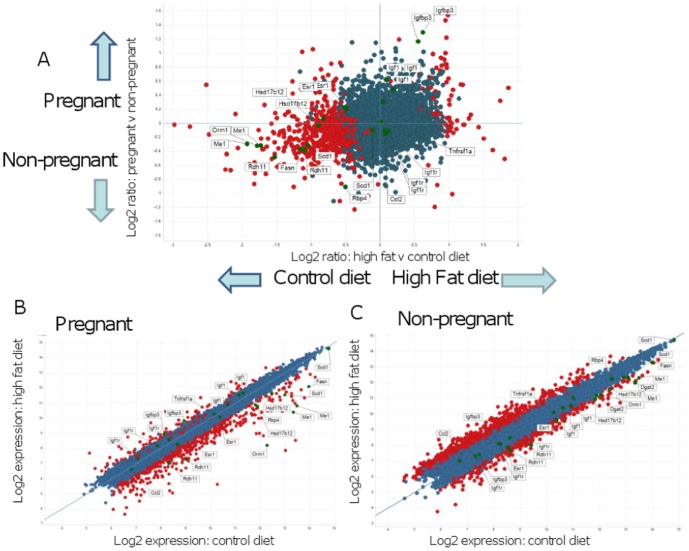
Figure 3. Array analysis of mesenteric fat depots from control and HF-fed obese mice using Spotfire Decision Site.
A. Log (base 2) ratios of gene expression intensities in pregnant and non-pregnant mice on the high fat and control diets. The y-axis shows the comparison of data from pregnant and non-pregnant mice regardless of diet. The x-axis compares high fat and control diets regardless of pregnancy status. Red spots represent genes that are significantly differentially expressed in pregnant mice on HF compared to control diet. Genes expressed below the arbitrary threshold (100) throughout the experiment were removed for clarity. Several genes of interest with higher expression in pregnant mice and on a high fat diet are marked and labelled. B. and C. Log (base 2) gene expression intensities in (B) Pregnant mice and (C) Non-pregnant mice on the high fat and control diets. For each group (pregnant or non pregnant), the y-axis shows the log2 expression in HF mice and the x-axis shows log2 expression in control mice. Red spots represent genes that are significantly differentially expressed in high fat diet compared to control diet for each pregnancy status. Several genes of interest discussed in the text are marked and labelled on graphs. Genes expressed below the arbitrary threshold (100) throughout the experiment were removed for clarity.

