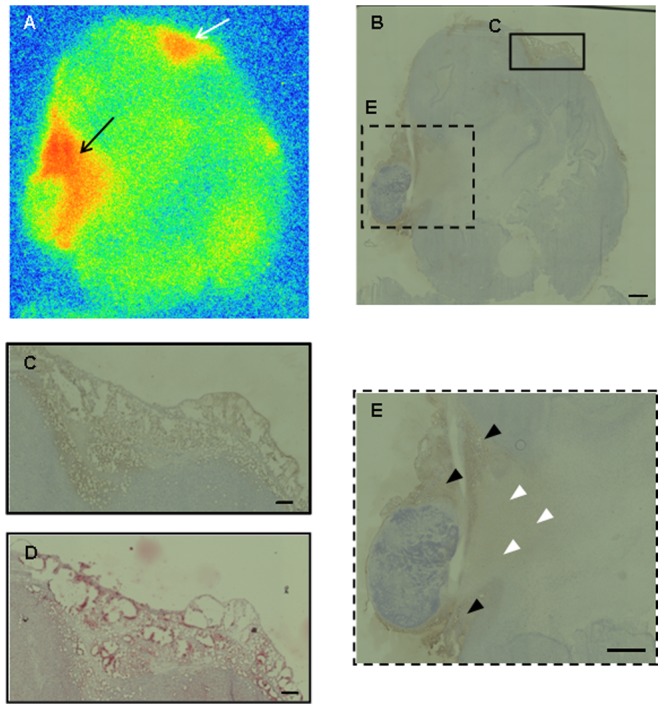
Figure 6. Regional distribution of radioactivity after [125I]TAP1 injection and FABP4 expression in tumor sections.

Autoradiogram (A) and immunohistochemical staining (B, C, E) of tumor sections. The frames in (B) show the location of the areas captured at higher magnification in C (solid line) and E (dashed line). (D) Oil Red staining of the same area as C. Bar = 1 mm (B, E) and 200 µm (C, D)
