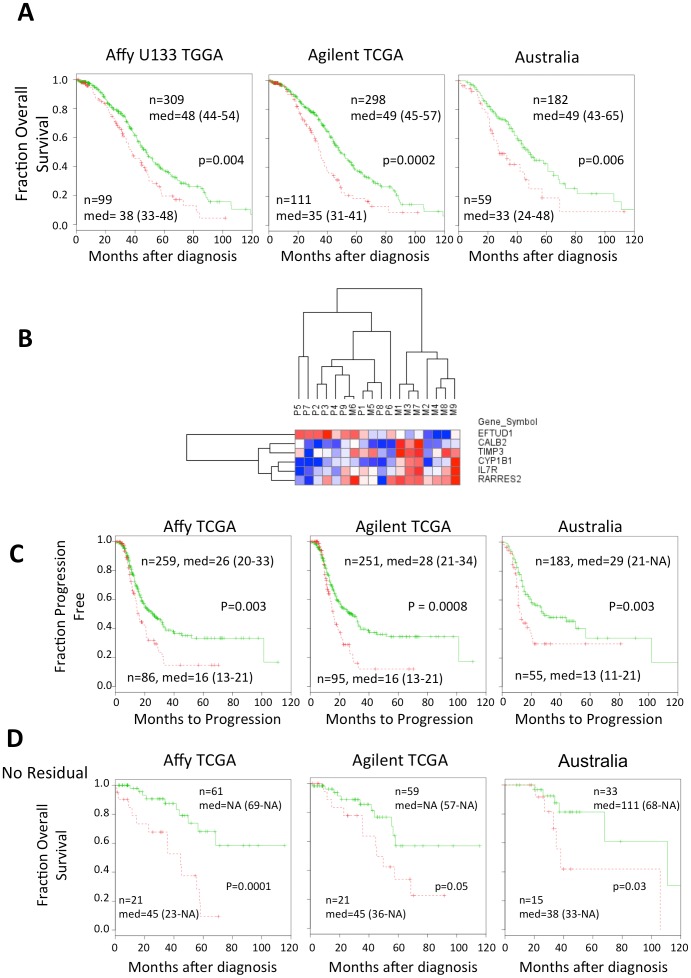
Figure 2. Six gene metastasis signature distinguishes aggressive disease in patients and primary and metastatic tumors.
A. Red dotted lines indicate high risk group and the green line indicates the low risk group. For each patient’s tumor, a point was given for each metastasis gene for which higher than median expression was associated with longer survival, and vice versa. Tumors with more than three points were classified as high risk. Only patients who were treated with platinum or taxane chemotherapy were included. Two microarray platforms from TCGA were evaluated (Affymetrix U133A and the Agilent Custom 244K). A second independent dataset on Affymetrix U133 Plus 2 microarrays from the Australian Oncology group was also evaluated [18], [24]. The median survival is shown with 95% confidence levels in parentheses. B. Hierarchical clustering of the six gene metastasis signature separates the primary and metastatic tumors. Red indicates higher and blue lower expression. C. The six gene metastatic signature distinguishes more aggressive disease using time to progression as a metric. D. The six gene signature predicts survival for cases with no residual disease. Cases in each dataset with no macro disease after surgery were gathered and evaluated for overall survival.

