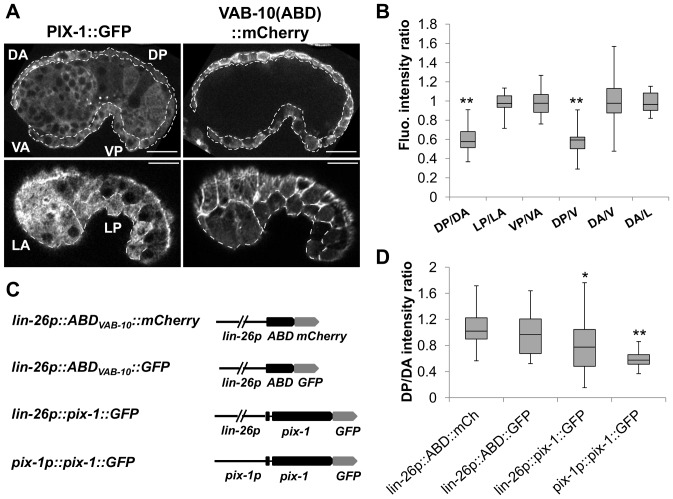
Figure 5. PIX-1::GFP is differentially expressed in hypodermal cells during elongation.
A) Confocal lateral projections of pix-1(gk416); sajEx1[pix-1p::pix-1::GFP]; mcIs40 [lin-26p::ABDvab-10::mcherry + myo-2p::gfp] embryos. Dorsal-anterior (DA, upper panel), dorsal-posterior (DP, upper panel), ventral-anterior (VA, upper panel), ventral-posterior (VP, upper panel), lateral-anterior (LA, lower panel) and lateral-posterior (LP, lower panel) hypodermis are surrounded by dashed line and have been identified using lin-26p::vab-10(ABD)::MCHERRY hypodermal markers. B) Distributions of the dorsal-posterior/dorsal-anterior (DP/DA), lateral-posterior/lateral-anterior (LP/LA), ventral-posterior/ventral-anterior (VP/VA), dorsal-posterior/ventral (DP/V); dorsal-anterior/ventral (DA/V), dorsal-anterior/lateral (DA/L) rates of fluorescence intensity measured in pix-1(gk416); sajEx1[pix-1p::pix-1::GFP; rol-6]; mcIs40 [lin-26p::ABDvab-10::mcherry + myo-2p::gfp] embryos between comma and 1.75-fold stages (n = 26 embryos). Similar results were also obtained in pix-1(gk416); sajIs1[pix-1p::pix-1::GFP; unc-119R]; mcIs40 [lin-26p::ABDvab-10::mcherry + myo-2p::gfp]. The box-plots represent the min, max, 25th, 50th (median) and 75th percentiles of the populations. ** T-test comparing ratios to 1 p<0.01. C) Schematic representation of pix-1::GFP and ABDVAB-10 (control) constructs used to measure the DP/DA intensity ratio reported in panel D. DP/DA of animals carrying mcIs40 (lin-26p::ABD::mCh expressing), mcIs50 (lin-26p::ABD::GFP expressing), sajIs2 (lin-26p::pix-1::GFP expressing) or sajEx1 (pix-1p::pix-1::GFP expressing). ratios** T-test comparing DP/DA ratios measured on pix-1::GFP expressing embryos to ratio measured in ABDVAB-10 expressing transgenics, p<0.01. The box-plots represent the min, max, 25th, 50th (median) and 75th percentiles of populations.

