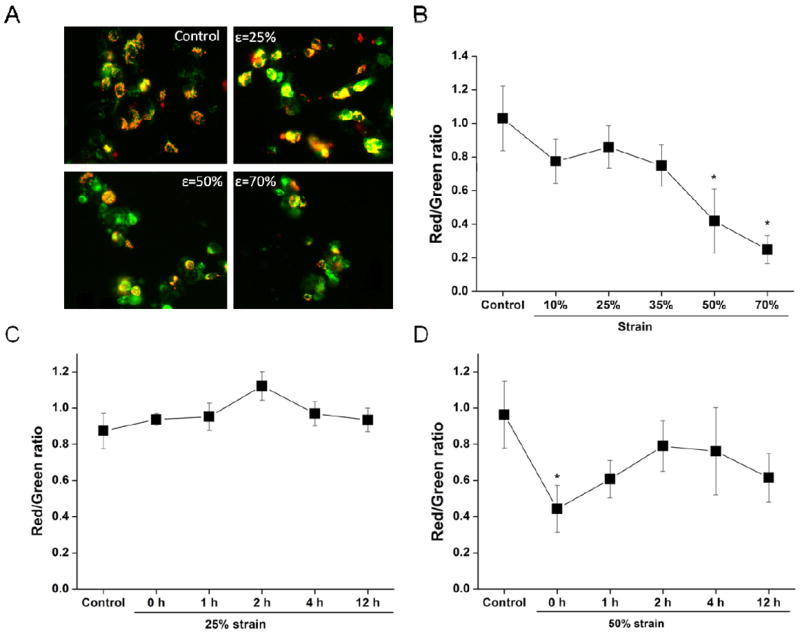
Figure 3. Effect of stretch on ΔΨm.

Cells were subject to the indicated strain levels. (A) Representative JC-1 fluorescence images for the indicated conditions. (B) Effects of strain on JC-1 staining (red/green ratio) at 0 h after insult measured by fluorescent microscopy. Temporal changes of ΔΨm after exposure to 25% (C) and 50% (D) strain of stretch (0, 1, 2, 4, 12 h). Data in graphs represent mean ± SEM of n = 4 experiments. *P< 0.05 compared with controls.
