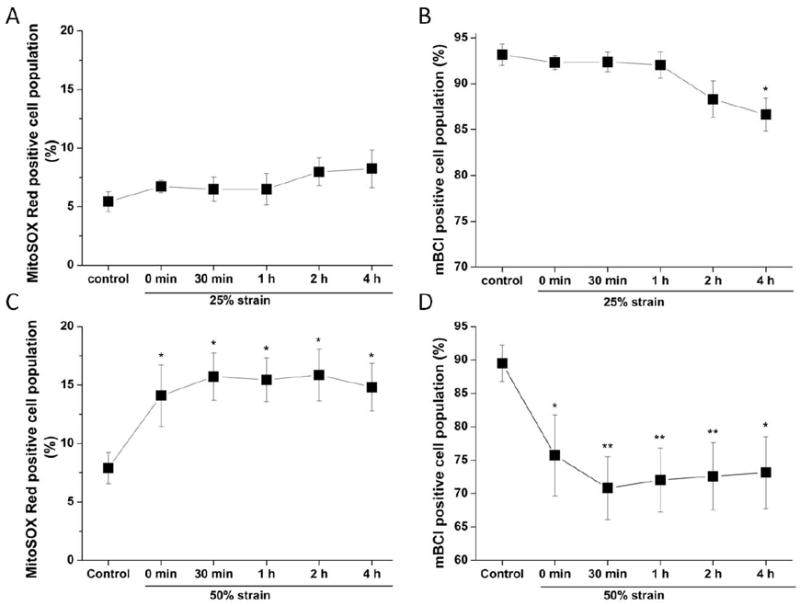
Figure 4. Time course of mitochondrial ROS generation and intracellular GSH levels in SH-SY5Y cells after stretch injury assessed by flow cytometry.

Cells were treated with 25% strain or 50% strain. Mitochondrial ROS and GSH were analyzed by FACS at the time indicated after stretch. In A (25% strain) and C (50% strain), data are expressed as mitochondrial ROS production (MitoSOX Red positive cell population, %). In B (25% strain) and D (50% strain), data are presented as intracellular GSH (mBCl positive cell population, %) normalized against control values. Data in graphs represent mean ± SEM of n = 5 experiments. *P< 0.05 and **P< 0.01 compared with control.
